
DNA Microarray
Summary
A DNA microarray is a tool that can be used for multiple different kinds of experiments. This entry will summarize the use of DNA microarrays to compare the gene expression profiles of two different cell or tissue samples.
Also known as:
DNA chip, biochip, GeneChip
Special note
The use of DNA microarrays to measure gene expression was very popular in the early 2000’s. However, in the 2010’s, RNA sequencing (RNA-seq) started to replace the microarray in large-scale gene expression experiments, since RNA-seq has several advantages over microarrays[1].
Samples needed
RNA from at least two cell or tissue samples
Controls
Many! More to be added later.
Method
First, reverse transcription PCR is used to reverse transcribe the RNA molecules present in each sample into cDNA. Then, the cDNA from sample A is labeled with one fluorescent molecule, and the cDNA from sample B is labeled with a second fluorescent molecule of a different color. The two samples are then applied at the same time to the microarray, which is a solid surface that contains many thousands of “spots” of DNA, each of a specific sequence. The cDNA from the samples is allowed to hybridize, or base-pair, with the DNA on the microarray. Then the microarray is “read” by measuring the intensity of each fluorescent molecule on each dot. Because the data often involves thousands of measurements, researchers often perform extensive analysis on it, including clustering analysis. When visualized, the data is often shown as a heatmap.
Interpretation
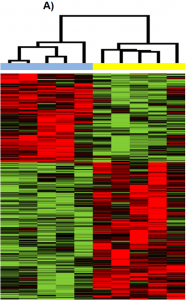 Figure 1. A heatmap showing the results of a gene expression experiment performed with a DNA microarray. The samples were early- and late-stage uterine serous carcinoma, a type of endometrial cancer. Relevant section of caption for published figure reads: “Hierarchical clustering of patient samples based on differentially expressed genes (P<0.01) obtained from comparing late stage versus early stage in the USC group… In clustering dendrogram, blue stands for early stage samples while yellow stands for late stage samples. Red means up-regulated while green means down regulated.” “Figure 1” by Paulette Mhawech-Fauceglia, Dan Wang, Joshua Kesterson, Kimberly Clark, Laketa Monhollen, Kunle Odunsi, Shashikant Lele, and Song Liu [2]. [Image description]
In Figure 1, each vertical column is a sample and each horizontal row is a gene. The heatmap shows only the genes that were significantly differently expressed across the ten samples, which the authors refer to as differentially expressed genes (DEGs). Then, the authors used a mathematical program to cluster, or group, the samples together based on which samples had the most similar gene expression profiles. The clustering program assigned the samples to two distinct clusters based on their expression profiles. In one cluster are all the early-stage samples, and in the second cluster are all the late-stage samples. This shows that the early and late stage samples have distinct gene expression profiles.
Image Descriptions
Figure 1 image description: A heatmap with 10 samples. The five early-stage samples on the left are in one cluster, and the other five, the late-stage samples, are in a second cluster. The early-stage cluster shows overexpressed genes in red at the top of the figure and green downregulated genes at the bottom of the figure. The genes that are overexpressed in the early-stage cluster are downregulated in the late-stage cluster and vice versa. [Return to Figure 1]
- Wang, Z., M. Gerstein, and M. Snyder. 2009. RNA-Seq: a revolutionary tool for transcriptomics. Nature Reviews Genetics 10:57-63. ↵
- Mhawech-Fauceglia, P., D. Wang, J. Kesterson, K. Clark, L. Monhollen, K. Odunsi, S. Lele, and S. Liu. 2010. Microarray analysis reveals distinct gene expression profiles among different tumor histology, stage and disease outcomes in endometrial adenocarcinoma. PLOS ONE 5:e15415. ↵
The process of genes being transcribed into RNA; Cells only express a fraction of available genes at any given time
A synthetic DNA molecule in which the sequence of bases is complementary to that of a given piece of DNA
