
Southern blot
Summary
A Southern blot shows the size of a piece of DNA with a particular sequence and is mostly used on digested genomic DNA. Often it is used to determine if a planned genetic modification has been successfully accomplished.
Also known as: N/A
Samples needed: Genomic DNA from cells or sample of interest
Controls: Controls should be performed to test a new probe but are often not shown in a publication.
Method:
Once genomic DNA is obtained, it is usually digested using one or more restriction enzymes. The resulting DNA fragments are separated by gel electrophoresis (insert link). Then, as shown in Figure 1 below, the DNA from the agarose gel is transferred onto a nitrocellulose filter by allowing a buffer to run through the gel, then the membrane, into a stack of dry blotting paper. Once the DNA is transferred to the filter, the filter is incubated with a labeled probe. Usually, the probe is labeled with 32P, which is radioactive. The probe is a nucleic acid sequence that is complementary to the genomic DNA of interest. Once the probe has hybridized with the DNA on the filter, excess probe is washed away. This leave invisible radioactive bands on the filter where the DNA sequence of interest is located. Finally, the filter is visualized. If the probe is radioactive, this is done by exposing an X-ray film to the filter. The film will then show bands at the location where the DNA sequence of interest was found on the filter, and ultimately, on the agarose gel.
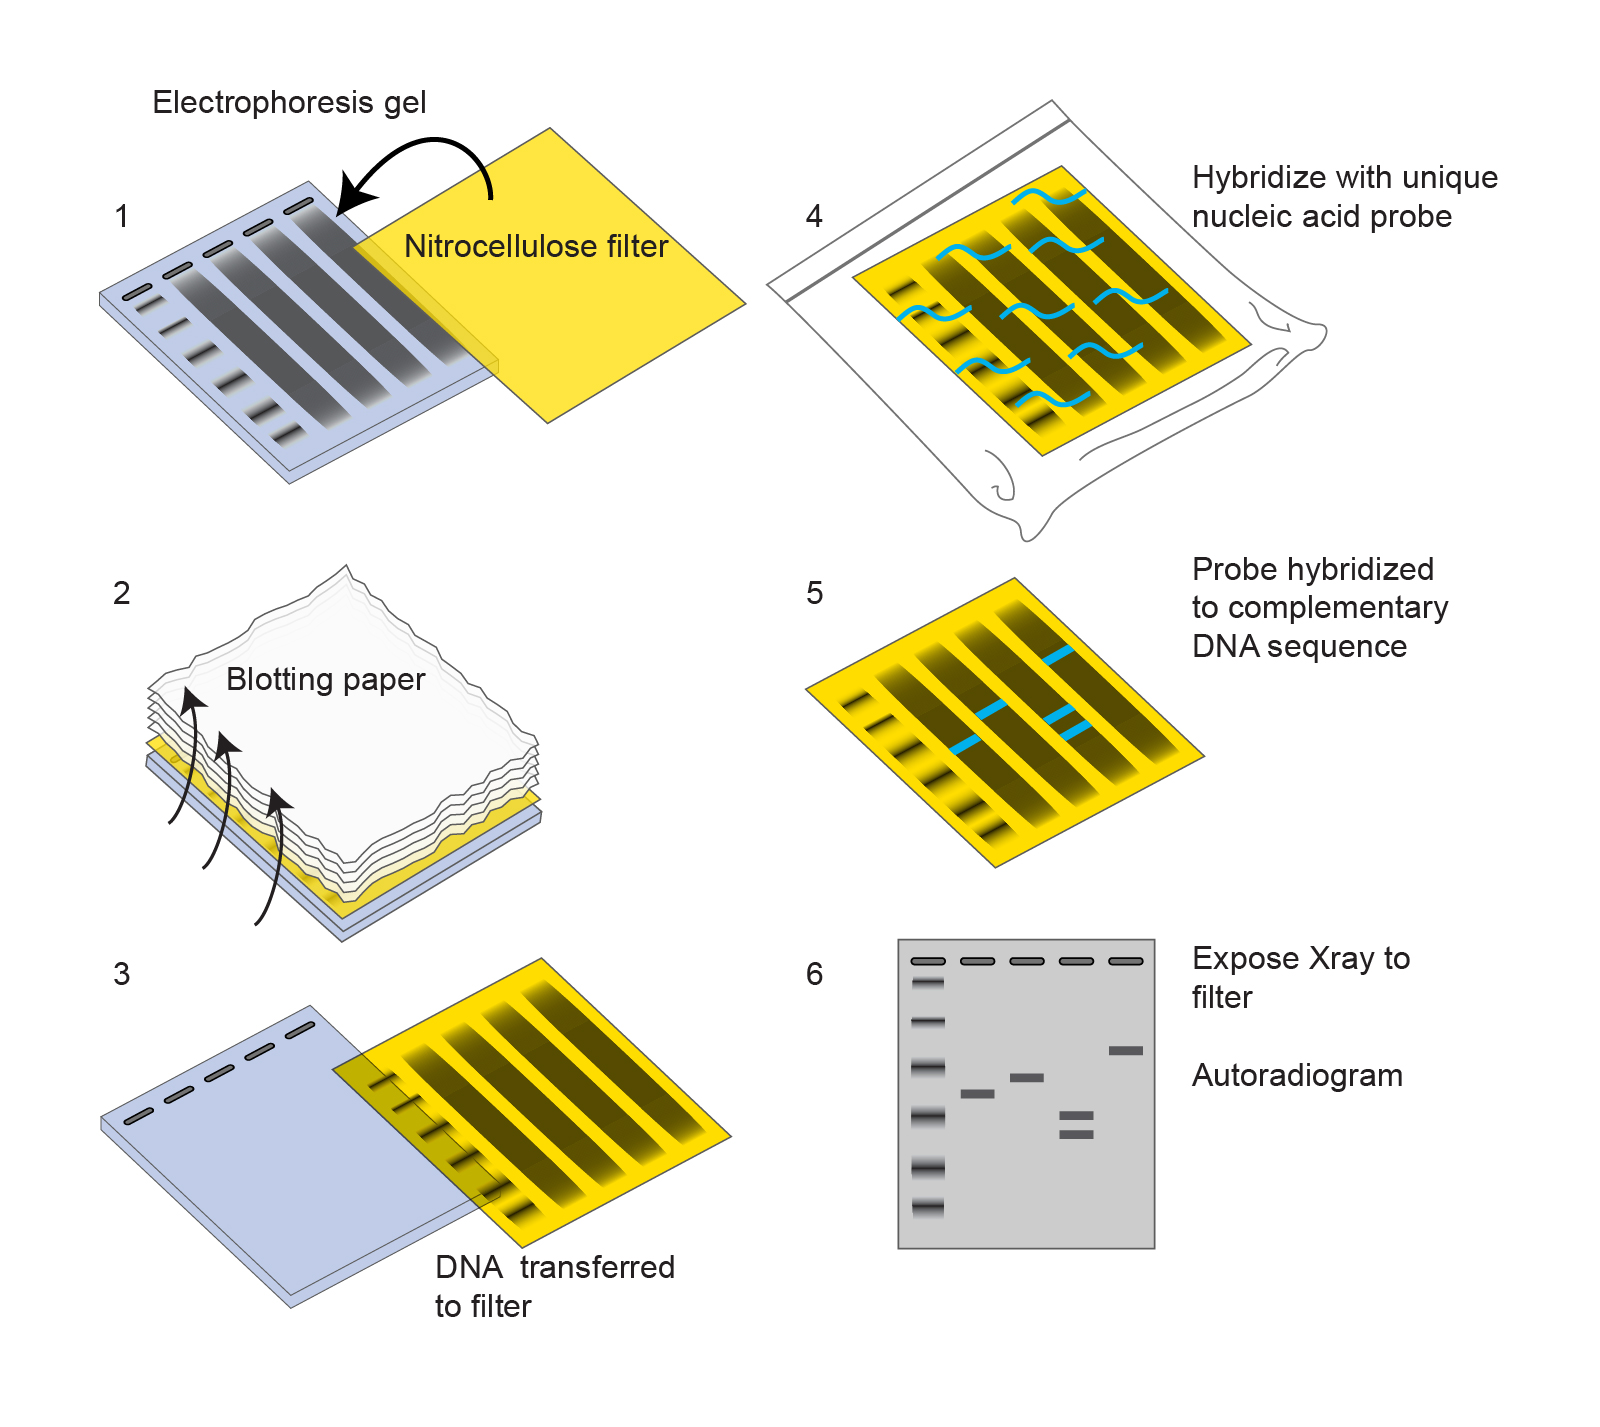
Figure 1. A schematic of a Southern blot protocol. “Southern Blot Illustration” by National Human Genome Research Institute. [Image description]
Interpretation:
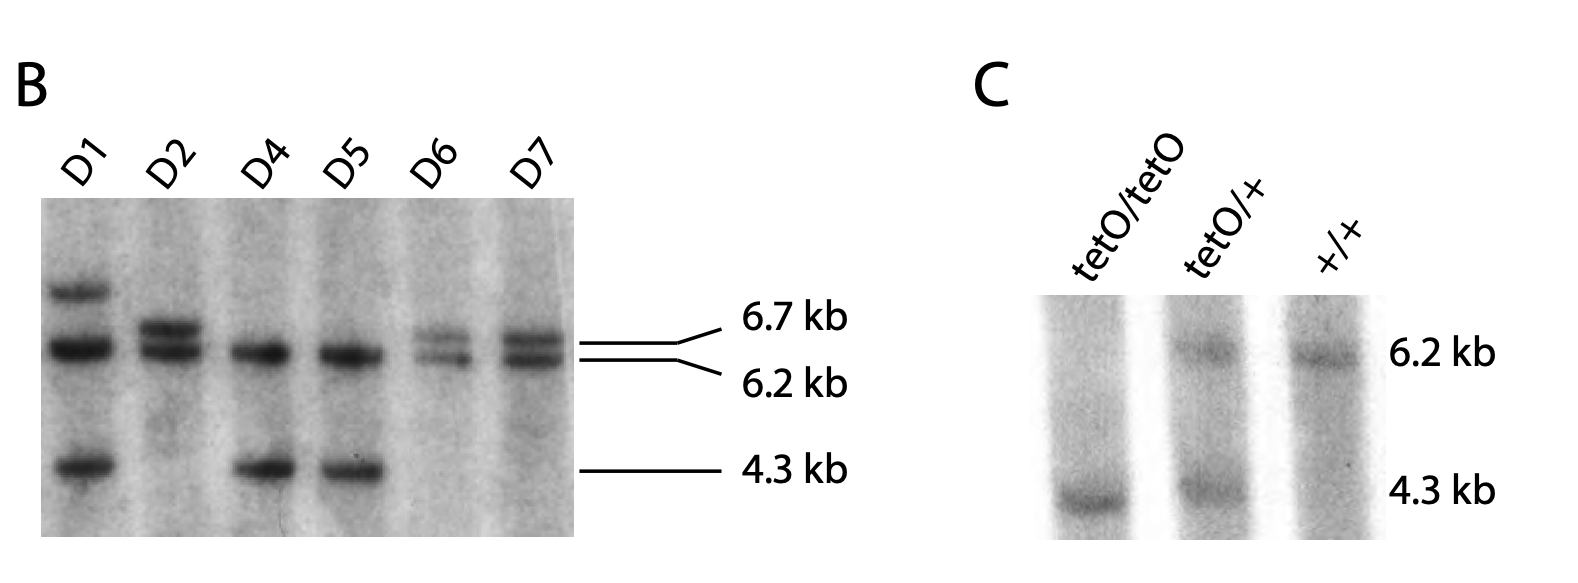 Figure 2. Southern blot results. Relevant section of caption for published figure reads: “(B) Southern blot analysis of SpeI-digested genomic DNA from six PHGDHtetO-targeted ES cells. Clones D4 and D5 exhibit proper targeting of the Col1A locus and an unaffected wild-type allele. (C) Southern blot analysis of SpeI-digested genomic DNA from mice of the indicated genotypes. ” “Figure S1” by Mattaini et al.[1]. [Image description]
Figure 2 above shows the results of a two Southern blots, the first from embryonic stem cells that the authors were attempting to genetically modify, and the second from the resulting genetically modified mice. Importantly, the ES cells being used already had a modification that allowed researchers to easily insert a gene of interest. Therefore, when the genomic DNA was cut with the restriction enzyme SpeI, three band sizes were possible. The wild type locus is shown by the 6.2 kb band, the initial modification (to allow a transgene to be inserted) is shown by a 6.7 kb band, and the locus with the gene of interest (PHGDH) successfully inserted is shown by a 4.3 kb band.
In panel B, ES cell clones D2, D6, and D7 show one wild type locus and one modified locus without PHGDH (bands at 6.2 and 6.7 kb). Clones D4 and D5 show one wild type locus and one locus with PHGDH (bands at 6.2 and 4.3 kb). Clone D1 has a band at an unexpected size, so that would not be a good clone to select to use to make genetically modified mice. Panel C shows that, as expected, mice that have been PCR genotyped as having two copies of PHGDH (“tetO/tetO”) have only the 4.2 kb band, mice with no transgene (“+/+”) have only the 6.2 kb band, and mice with one copy of PHGDH (“tetO/+”) have both bands.
Note that when all of the DNA in a mouse cell is digested with SpeI, a huge smear of DNA would be seen on a DNA gel if a normal gel visualization method like ethidium bromide were used. The use of a probe complementary to the locus of interest allows the researchers to see only the bands they care about, not every single SpeI fragment.
Image Descriptions
Figure 1 image description: 1. A nitrocellulose filter placed on top of an electophoresis gel with DNA smears in each lane and a ladder on the left. 2. Liquid shown flowing up from the gel through the filter into a stack of blotting paper. 3. The DNA shown transferred to the filter. 4. The filter shown in a clear bag incubating with a labeled unique nucleic acid probe. 5. The filter with probe hybridized to complementary DNA sequence. 6. Once the filter is exposed to an X-ray film, the film shows bands only where the probe was hybridized to the membrane. [Return to Figure 1]
Results of first Southern blot:
| D1 | D2 | D4 | D5 | D6 | D7 | |
| Band >6.7 kb | x | |||||
| 6.7 kb | x | x | x | |||
| 6.2 kb | x | x | x | x | x | x |
| 4.3 kb | x | x | x |
Results of second Southern blot:
| tetO/tetO | tetO/+ | +/+ | |
| 6.2 kb | x | x | |
| 4.3 kb | x | x |
- Mattaini, K. R., M. R. Sullivan, A. N. Lau, B. P. Fiske, R. T. Bronson, and M. G. Vander Heiden. 2019. Increased PHGDH expression promotes aberrant melanin accumulation. BMC Cancer 19:723. ↵
Cuts DNA at a particular sequence
