
QIBC
Summary
QIBC is an automated, high-throughput analysis method to collect and display data on large numbers of single cells from immunofluorescence microscopy images. The data is displayed in a scatter diagram and resembles data from a flow cytometry (add link) experiment.
Also known as:
Quantitative image-based cytometry
Samples needed
Immunofluorescence images
Controls
Not controls per se, but it is important in this analysis to make sure that images aren’t saturated, that a large number of cells (5,000-10,000) are analyzed, as well as other quality control measures.
Method
A computer program is used to analyze immunofluorescence images of a sample. The program identifies the intensity of each color fluorescence used on a single-cell basis. Then each cell is plotted as a dot on a scatterplot. Therefore, the scatterplot represents the population of cells in each sample.
Interpretation
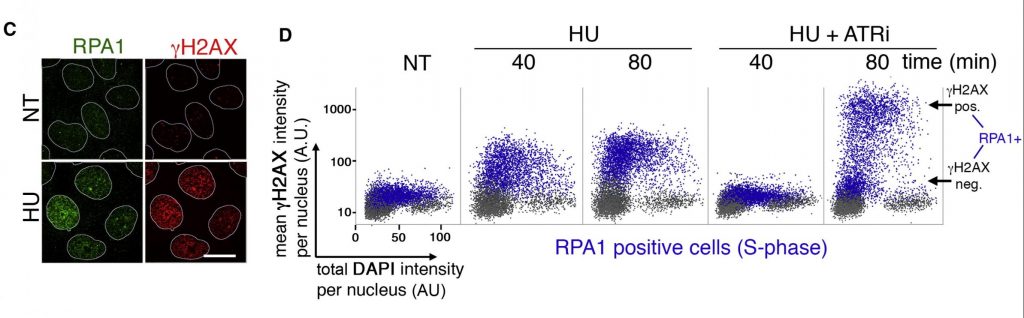 Figure 1. QIBC analysis of U-2-OS osteosarcoma cells treated with either hydroxyurea (HU) alone or HU wih an ATR inhibitor (ATRi). Relevant section of caption for published figure reads: “(C) U-2-OS cells were treated with HU for 40 min, pre-extracted, and immunostained with the indicated antibodies. Scale bar, 10 μm. (D) Quantitative image-based cytometry single-cell analysis (QIBC) of immunolabeled U-2-O-S cells. Asynchronous cells were treated with HU (2 mM) and ATRi (2 μM) for the indicated times and immunostained as in (C). Total nuclear intensity for DAPI, mean nuclear intensities for RPA1 (chromatin-bound fraction [CB]), and γ-H2AX were determined for each of >5,000 individual cells and were plotted in a scatter diagram. S phase cells, with chromatin-loaded RPA1, are labeled in blue.” “Figure 1” by Luis Ignacio Toledo, Matthias Altmeyer, Maj-Britt Rask, Claudia Lukas, Dorthe Helena Larsen, Lou Klitgaard Povlsen, Simon Bekker-Jensen, Niels Mailand, Jiri Bartek, Jiri Lukas[1]. [Image description]
In Figure 1 above, panel C shows an example of the images on which QIBC was performed. Panel D shows the scatterplots made through QIBC analysis. In this diagram, blue dots represent cells that are positive for RPA1 that is chromatin-bound, or in other words, cells that are in S-phase. Grey dots are in other phases of the cell cycle. A dot placed farther right on the x-axis has a greater DAPI signal than one on the left. A dot placed farther up on the y-axis has a greater γH2AX signal than one further down.
HU depletes dNTPs, the building blocks of DNA. This leads to replication stress and stalled replication forks. HU treatment increases the proportion of cells that are γH2AX positive compared to cells with no treatment (NT). However, simultaneous treatment with HU and an ATR inhibitor leads to more cells with very high amounts of γH2AX, a hallmark of ATM activation.
Image Descriptions
Figure 1 image description: Panels C and D from a scientific paper.
Panel C shows four immunofluorescence microscopy images. In all images, nuclei are surrounded by a white line. No treatment images show no discernible nuclear RPA1 or γH2AX expression. With HU treatment, there is significant nuclear RPA1 and γH2AX expression.
Panel D shows the results of QIBC analysis in five scatterplots. Each plot contains approximately 5,000-10,000 data points. The x-axis measures total DAPI intensity per nucleus (A.U.), and the y-axis measures mean γH2AX intensity per nucleus (A.U.). In each plot, grey data points are RPA1-negative. These show a range of DAPI intensities (10-100 A.U.) and low γH2AX intensity (10-30 A.U.) in all cases. Blue data points show RPA1-positive cells and vary depending on conditions.
- No treatment: RPA1-positive cells are similar to RPA1-negative cells with low γH2AX intensity (30-50 A.U.).
- HU, 40 min: Increasing levels of γH2AX, 30-300 A.U.
- HU, 80 min: Mostly intermediate levels of γH2AX, 90-300 A.U.
- HU + ATRi, 40 min: RPA1-positive cells are similar to RPA1-negative cells with low γH2AX intensity (30-50 A.U.).
- HU + ATRi, 80 min: There are two main populations of RPA1-positive cells. The first population has relatively low γH2AX intensity (30-50 A.U.). The second population has high γH2AX intensity (800-1000 A.U.). The density of points between the two is sparse but appreciable.
- Toledo, L. I., M. Altmeyer, M. Rask, C. Lukas, D. H. Larsen, L. K. Povlsen, S. Bekker-Jensen, N. Mailand, J. Bartek, and J. Lukas. 2013. ATR prohibits replication catastrophe by preventing global exhaustion of RPA. Cell 155:1088-1103. ↵
Replication protein A; coats single-stranded DNA in eukaryotic cells; ssDNA is formed routinely during DNA replication
Phase of the cell cycle when DNA replication occurs (DNA synthesis phase)
Orderly sequence of events leading up to and during cell division; includes G1, S, G2 and M phases
4′,6-diamidino-2-phenylindole, used to label DNA (and therefore the nucleus) in fluorescence microscopy
H2AX is a histone, one of the proteins found in nucleosomes; γH2AX is H2AX that has been phosphorylated on serine 139, a marker of DNA double-strand breaks
Ataxia telangiectasia and Rad3 related protein, a serine/threonine kinase involved in repair of single-strand DNA breaks
A serine-threonine kinase whose mutations are responsible for the disorder ataxia–telangiectasia; recruited and activated by double-stranded DNA breaks, leading to the activation of a genome maintenance program
