
Chapter 18. Mendelian Genetics

Chapter Outline
- 18.1 Mendel’s Experiments
- 18.2 Mendel’s Principles of Inheritance
- 18.3 Exceptions to Mendel’s Principles of Inheritance
Introduction
Genetics is the study of heredity. Johann Gregor Mendel (1822–1884) set the framework for genetics long before chromosomes or genes had been identified, at a time when meiosis was not well understood (Figure 18.2). Mendel selected a simple biological system and conducted methodical, quantitative analyses using large sample sizes. Because of Mendel’s work, the fundamental principles of heredity were revealed. We now know that genes, carried on chromosomes, are the basic functional units of heredity with the capability to be replicated, expressed, or mutated. Today, the postulates put forth by Mendel form the basis of classical, or Mendelian, genetics. Not all genes are transmitted from parents to offspring according to Mendelian genetics, but Mendel’s experiments serve as an excellent starting point for thinking about inheritance.
18.1 | Mendel’s Experiments
Learning Objectives
By the end of this section, you will be able to:
- Describe the scientific reasons for the success of Mendel’s experimental work.
- Describe the expected outcomes of monohybrid crosses involving dominant and recessive alleles.
Johann Gregor Mendel (1822–1884) was a lifelong learner, teacher, scientist, and man of faith. As a young adult, he joined the Augustinian Abbey of St. Thomas in Brno in what is now the Czech Republic. Supported by the monastery, he taught physics, botany, and natural science courses at the secondary and university levels. In 1856, he began a decade-long research pursuit involving inheritance patterns in honeybees and plants, ultimately settling on pea plants as his primary model system. In 1865, Mendel presented the results of his experiments with nearly 30,000 pea plants to the local Natural History Society. He demonstrated that traits are transmitted faithfully from parents to offspring independently of other traits and in dominant and recessive patterns. In 1866, he published his work, Experiments in Plant Hybridization[1] in the proceedings of the Natural History Society of Brünn.
Mendel’s work went virtually unnoticed by the scientific community that believed, incorrectly, that the process of inheritance involved a blending of parental traits that produced an intermediate physical appearance in offspring; this hypothetical process appeared to be correct because of what we know now as continuous variation. Continuous variation results when many genes work together to determine a characteristic, such as human height or eye color. Offspring appear to be a “blend” of their parents’ traits when we look at characteristics that exhibit continuous variation.
Mendel worked with traits that were inherited in distinct classes, such as violet versus white flowers. These traits display discontinuous variation. Mendel’s choice of these kinds of traits allowed him to see that the traits were not blended in the offspring, nor were they absorbed, but rather that they kept their distinctness and could be passed on. In 1868, Mendel became abbot of the monastery and exchanged his scientific pursuits for his pastoral duties. He was not recognized for his extraordinary scientific contributions during his lifetime. In fact, it was not until 1900 that his work was rediscovered, reproduced, and revitalized by scientists on the brink of discovering the chromosomal basis of heredity.
18.1.1 Mendel’s Model System
Mendel’s seminal work was accomplished using the garden pea, Pisum sativum, to study inheritance. This species naturally self-fertilizes, such that pollen encounters ova within individual flowers. The flower petals remain sealed tightly until after pollination, preventing pollination from other plants. The result is highly inbred, or “true-breeding,” pea plants. These are plants that always produce offspring that look like the parent. By experimenting with true-breeding pea plants, Mendel avoided the appearance of unexpected traits in offspring that might occur if the plants were not true breeding. The garden pea also grows to maturity within one season, meaning that several generations could be evaluated over a relatively short time. Finally, large quantities of garden peas could be cultivated simultaneously, allowing Mendel to conclude that his results did not come about simply by chance.
18.1.2 Mendelian Crosses
Mendel performed hybridizations, which involve mating two true-breeding individuals that have different traits. In the pea, this is done by manually transferring pollen from one pea plant to the stigma of another pea plant. In plants, pollen carries the male gametes (sperm) to the stigma, a sticky organ that traps pollen and allows the sperm to move down the pistil to the female gametes (ova) below. To prevent the pea plant that was receiving pollen from self-fertilizing and confounding his results, Mendel painstakingly removed all of the pollen-producing anthers from the plant’s flowers before they had a chance to mature.
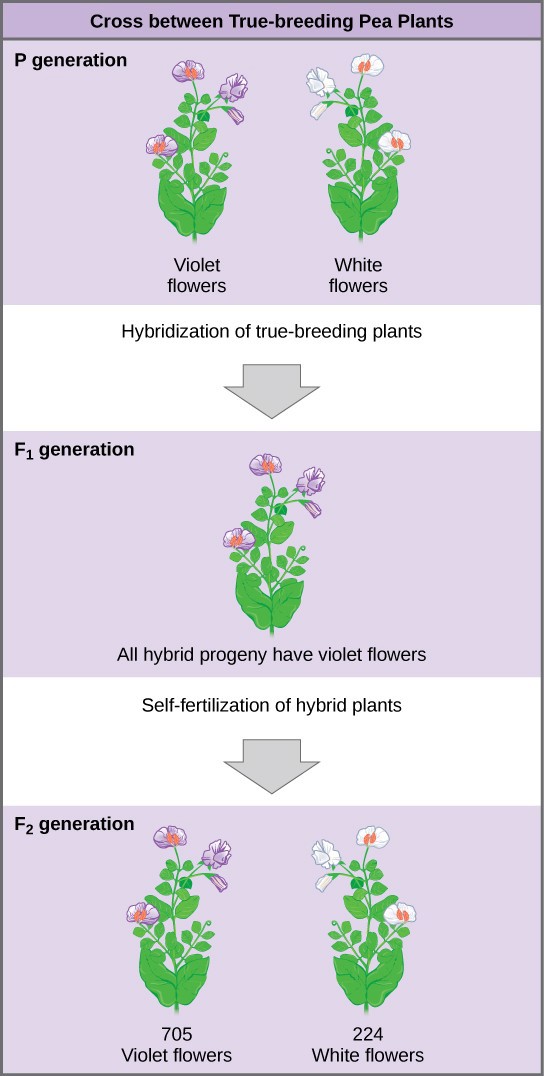
Plants used in first-generation crosses were called P, or parental generation, plants (Figure 18.3). Mendel collected the seeds that resulted from each cross and grew them the following season. These offspring were called the F1, or the first filial (filial = offspring, daughter or son), generation. Once Mendel examined the characteristics in the F1 generation of plants, he allowed them to self-fertilize. He then collected and grew the seeds from the F1 plants to produce the F2, or second filial, generation. Mendel’s experiments extended beyond the F2 generation to the F3 and F4 generations, and so on, but it was the ratio of characteristics in the P−F1−F2 generations that were the most intriguing and became the basis for Mendel’s principles.
18.1.3 Garden Pea Characteristics Revealed the Basics of Heredity
In his 1865 publication, Mendel reported the results of his crosses involving seven different characteristics, each with two contrasting traits. A trait is defined as a variation in the physical appearance of a heritable characteristic. The characteristics include: tall vs. short plant height, wrinkled vs. round seeds, green vs. yellow seeds, violet vs. white flowers, etc. (Table 18.1). To fully examine each characteristic, Mendel generated large numbers of F1 and F2 plants, reporting results from 19,959 F2 plants alone.
As an example, let us look at Mendel’s results for the flower color trait. First, Mendel confirmed that he had plants that bred true for white or violet flower color. Regardless of how many generations Mendel examined, all self-crossed offspring of parents with white flowers had white flowers, and all self-crossed offspring of parents with violet flowers had violet flowers. In addition, Mendel confirmed that, other than flower color, the pea plants were physically identical.
Once these validations were complete, Mendel applied pollen from a plant with violet flowers to the stigma of a plant with white flowers. After gathering and sowing the seeds that resulted from this cross, Mendel found that 100 percent of the F1 hybrid generation had violet flowers. Conventional wisdom at that time would have predicted the hybrid flowers to be pale violet or for hybrid plants to have equal numbers of white and violet flowers. In other words, the contrasting parental traits were expected to blend in the offspring. Instead, Mendel’s results demonstrated that the white flower trait in the F1 generation had completely disappeared.
Importantly, Mendel did not stop his experimentation there. He allowed the F1 plants to self-fertilize and found that, of F2- generation plants, 705 had violet flowers and 224 had white flowers. This was a ratio of 3.15 violet flowers per one white flower, or approximately 3:1. When Mendel transferred pollen from a plant with violet flowers to the stigma of a plant with white flowers and vice versa, he obtained about the same ratio regardless of which parent, male or female, contributed which trait. This is called a reciprocal cross—a paired cross in which the respective traits of the male and female in one cross become the respective traits of the female and male in the other cross. For the other six characteristics Mendel examined, the F1 and F2 generations behaved in the same way as they had for flower color. One of the two traits would disappear completely from the F1 generation only to reappear in the F2 generation at a ratio of approximately 3:1 (Table 18.1).
Table 18.1 The Results of Mendel’s Garden Pea Hybridizations
|
Characteristic |
Contrasting P0 Traits |
F1 Offspring Traits |
F2 Offspring Traits |
F2 Trait Ratios |
|
Flower color |
Violet vs. white |
100 percent violet |
705 violet 224 white |
3.15:1 |
|
Flower position |
Axial vs. terminal |
100 percent axial |
651 axial 207 terminal |
3.14:1 |
|
Plant height |
Tall vs. dwarf |
100 percent tall |
787 tall 277 dwarf |
2.84:1 |
|
Seed texture |
Round vs. wrinkled |
100 percent round |
5,474 round 1,850 wrinkled |
2.96:1 |
|
Seed color |
Yellow vs. green |
100 percent yellow |
6,022 yellow 2,001 green |
3.01:1 |
|
Pea pod texture |
Inflated vs. constricted |
100 percent inflated |
882 inflated 299 constricted |
2.95:1 |
|
Pea pod color |
Green vs. yellow |
100 percent green |
428 green 152 yellow |
2.82:1 |
18.2 | Mendel’s Principles of Inheritance
Learning Objectives
By the end of this section, you will be able to:
- Describe the three principles of inheritance.
- Explain the relationship between phenotype and genotype.
- Develop a Punnett square to calculate the expected proportions of genotypes and phenotypes in a monohybrid cross.
- Explain the purpose and methods of a test cross.
- Draw and interpret a pedigree.
Mendel generalized the results of his pea-plant experiments into three principles that describe the basis of inheritance in diploid organisms. They are: the principle of segregation, the principle of dominance, and the principle of independent assortment. Together, these principles summarize the basics of classical, or Mendelian, genetics.
18.2.1 The Principle of Segregation
Since the white flower trait reappeared in the F2 generation, Mendel saw that the traits remained separate (not blended) in the plants of the F1 generation. This led to the principle of segregation, which states that individuals have two copies of each trait, and that each parent transmits one of its two copies to its offspring.
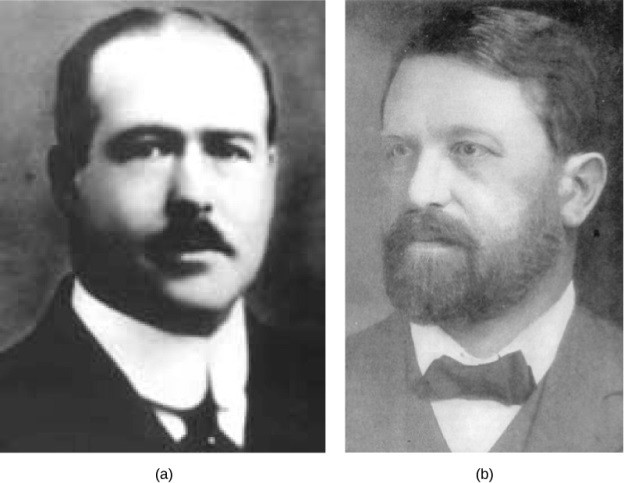
We now know that the traits that are passed on are a result of genes that are inherited on chromosomes during meiosis and fertilization. The fact that the genetic factors proposed by Mendel were carried on chromosomes was proposed in 1902 by Walter and Sutton and Theodor Boveri (Figure 18.4) as the Chromosomal Theory of Inheritance.
Different versions of genes are called alleles. Diploid organisms that have two identical alleles of a gene on their two homologous chromosomes are homozygous for that trait. Diploid organisms that have two different alleles of a gene on their two homologous chromosomes are heterozygous for that trait.
The physical basis of the principle of segregation is the first division of meiosis, in which the homologous chromosomes with their different versions of each gene are segregated into daughter nuclei. Since each gamete receives only one homolog of each chromosome, it follows that they receive only one allele for each trait. At fertilization, the zygote receives one of each homologous chromosome, and one of each allele, from each parent.
18.2.2 The Principle of Dominance
Upon compiling his results for many thousands of plants, Mendel concluded that the characteristics could be divided into dominant and recessive traits. Dominant traits are those that are expressed in a hybridization. Recessive traits become latent, or disappear, in the offspring of a hybridization but reappear in the progeny of the hybrid offspring. Thus, the violet-flower trait is dominant and the white-flower trait is recessive.
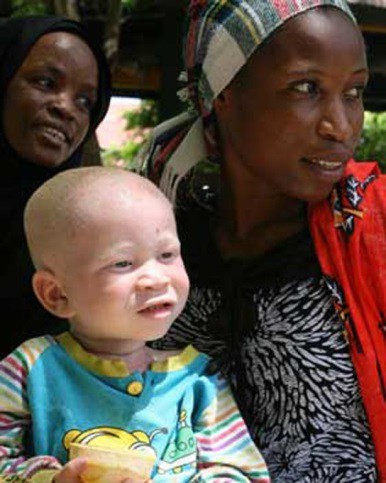
The principle of dominance states that in a heterozygote, only the dominant allele will be expressed. The recessive allele will remain “latent” but will be transmitted to offspring by the same manner in which the dominant allele is transmitted. The recessive trait will only be expressed by offspring that have two copies of this allele (Figure 18.5). Individuals with a dominant trait could have either two dominant versions of the trait or one dominant and one recessive version of the trait. Individuals with a recessive trait have two recessive alleles.
In Mendel’s experiments, the principle of dominance explains why the F1 heterozygous offspring were identical to one of the parents, rather than expressing both alleles. For a gene that is expressed in a dominant and recessive pattern, homozygous dominant and heterozygous organisms will look identical. The recessive allele will only be observed in homozygous recessive individuals. Some examples of human dominant and recessive traits are shown in Table 18.2.
Table 18.2 Examples of dominant and recessive traits in humans.
|
Dominant Traits Recessive Traits |
|
|
Achondroplasia |
Albinism |
|
Brachydactyly |
Cystic fibrosis |
|
Huntington’s disease |
Duchenne muscular dystrophy |
|
Marfan syndrome |
Galactosemia |
|
Neurofibromatosis |
Phenylketonuria |
|
Widow’s peak |
Sickle-cell anemia |
|
Wooly hair |
Tay-Sachs disease |
The principles of segregation and dominance could be deduced by simple crosses that follow only one genetic trait. These crosses are called monohybrid crosses. Before we discuss the principle of independent assortment, let’s look at some tools and terminology used for monohybrid crosses.
18.2.3 Phenotypes and Genotypes
Several conventions exist for referring to genes and alleles. For the purposes of this chapter, we will abbreviate genes using the first letter of the gene’s corresponding dominant trait. For example, green is the dominant trait for pea pod color, so the pod-color gene would be abbreviated as G (note that it is customary to italicize gene designations). Furthermore, we will use uppercase and lowercase letters to represent dominant and recessive alleles, respectively. Therefore, we would refer to the genotype of a homozygous dominant pea plant with green pods as GG, a homozygous recessive pea plant with yellow pods as gg, and a heterozygous pea plant with green pods as Gg.
The two alleles for each given gene in a diploid organism may be expressed and interact to produce physical characteristics. The observable traits expressed by an organism are referred to as its phenotype. An organism’s underlying genetic makeup, which alleles it has, is called its genotype. Mendel’s hybridization experiments demonstrate the difference between phenotype and genotype. When true-breeding plants in which one parent had yellow pods and one had green pods were cross-fertilized, all of the F1 hybrid offspring had green pods. Although the hybrid offspring had the same phenotype as the true-breeding parent with green pods, we know that the genotype of the parent was homozygous dominant (GG), while the genotype of the F1 offspring was heterozygous (Gg). We know this since the yellow pod allele reappeared in some of the F2 offspring (gg).
18.2.4 Using Punnett Squares for Monohybrid Crosses
Punnett squares, devised by the British geneticist Reginald Punnett, can be used to predict the possible outcomes of a genetic cross or mating and their expected frequencies. To demonstrate a monohybrid cross, consider the case of true- breeding pea plants with yellow versus green pea seeds. The dominant seed color is yellow; therefore, the parental genotypes were YY for the plants with yellow seeds and yy for the plants with green seeds, respectively. To prepare a Punnett square, all possible combinations of the parental alleles are listed along the top (for one parent) and side (for the other parent) of a grid, representing their meiotic segregation into haploid gametes. Then the combinations of egg and sperm are made in the boxes in the table to show which alleles are combining. Each box then represents the diploid genotype of a zygote, or fertilized egg, that could result from this mating. Because each possibility is equally likely, genotypic ratios can be determined from a Punnett square. If the pattern of inheritance (dominant or recessive) is known, the phenotypic ratios can be inferred as well. For a monohybrid cross of two true-breeding parents, each parent contributes one type of allele. In this case, only one genotype is possible. All offspring are Yy and have yellow seeds (Figure 18.6).
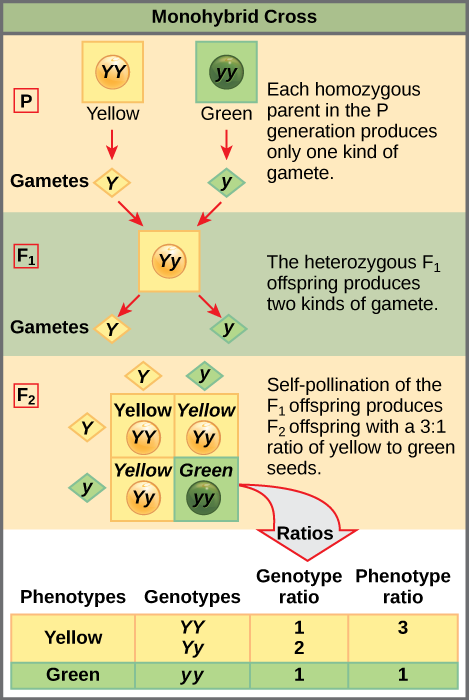
A self-cross of one of the Yy heterozygous offspring can be represented in a 2 × 2 Punnett square because each parent can donate one of two different alleles. Therefore, the offspring can potentially have one of four allele combinations: YY, Yy, yY, or yy (Figure 18.6). Notice that there are two ways to obtain the Yy genotype: a Y from the egg and a y from the sperm, or a y from the egg and a Y from the sperm. Both of these possibilities must be counted. Recall that Mendel’s pea- plant characteristics behaved in the same way in reciprocal crosses. Therefore, the two possible heterozygous combinations produce offspring that are genotypically and phenotypically identical despite their dominant and recessive alleles deriving from different parents.
Because fertilization is a random event, we expect each combination to be equally likely and for the offspring to exhibit a ratio of YY:Yy:yy genotypes of 1:2:1 (Figure 18.6). Furthermore, because the YY and Yy offspring have yellow seeds and are phenotypically identical, we expect the offspring to exhibit a phenotypic ratio of 3 yellow:1 green. Indeed, working with large sample sizes, Mendel observed approximately this ratio in every F2 generation resulting from crosses for individual traits.
Using a Test Cross to Determine Genotype
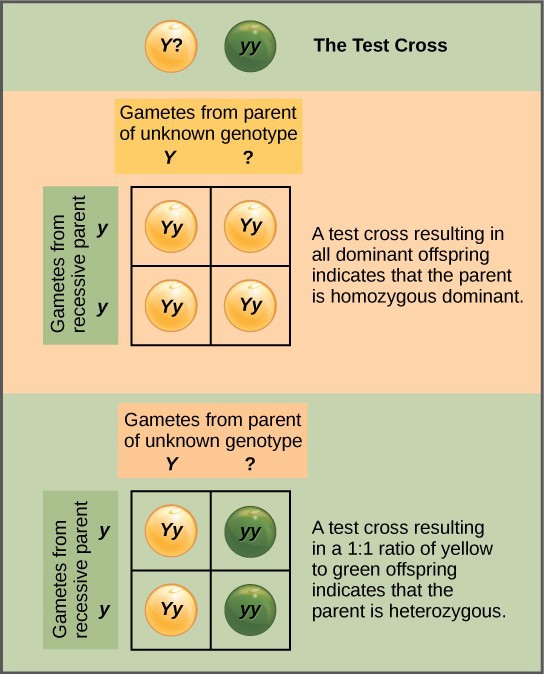
Beyond predicting the offspring of a cross between known homozygous or heterozygous parents, Mendel also developed a way to determine whether an organism that expressed a dominant trait was a heterozygote or a homozygote. Called the test cross, this technique is still used by plant and animal breeders. In a test cross, an organism with the dominant phenotype is crossed with an organism that is homozygous recessive for the same characteristic. If the dominant- expressing organism is a homozygote, then all F1 offspring will be heterozygotes expressing the dominant trait. Alternatively, if the dominant expressing organism is a heterozygote, the F1 offspring will exhibit a 1:1 ratio of heterozygotes and recessive homozygotes (Figure 18.7). The test cross further validates Mendel’s postulate that pairs of unit factors segregate equally.
Concept Check
In pea plants, round peas (R) are dominant to wrinkled peas (r). You do a test cross between a pea plant with wrinkled peas (genotype rr) and a plant of unknown genotype that has round peas. You end up with three plants, all which have round peas.
- From this data, can you tell if the round pea parent plant is homozygous dominant or heterozygous?
- If the round pea parent plant is heterozygous, what is the probability that a random sample of 3 progeny peas will all be round?
18.2.5 Using Pedigrees to Study Inheritance Patterns
Many human diseases are inherited genetically. A healthy person in a family in which some members suffer from a recessive genetic disorder may want to know if he or she has the disease-causing gene and what risk exists of passing the disorder on to his or her offspring. Of course, doing a test cross in humans is unethical and impractical. Instead, geneticists use pedigree analysis to study the inheritance pattern of human genetic diseases.
Each row of a pedigree represents one generation of the family. Women are represented by circles; males by squares. People who had children together are connected with a horizontal line and their children are connected to this line with a vertical line. See Figure 18.8 for an example of a pedigree for a human genetic disease.
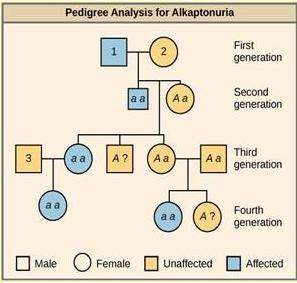
People with the recessive genetic disease alkaptonuria cannot properly metabolize two amino acids, phenylalanine and tyrosine. Affected individuals may have darkened skin and brown urine, and may suffer joint damage and other complications.
In this pedigree, individuals with the disorder are indicated in blue and have the genotype aa. Unaffected individuals are indicated in yellow and have the genotype AA or Aa. Note that it is often possible to determine a person’s genotype from the genotype of their offspring. For example, if neither parent has the disorder but their child does, both parents must be heterozygous. Two individuals on the pedigree have an unaffected phenotype but unknown genotype. Because they do not have the disorder, they must have at least one normal allele, so their genotype gets the “A?” designation.
Concept Check
What are the genotypes of the individuals labeled 1, 2, and 3?
18.2.6 Principle of Independent Assortment
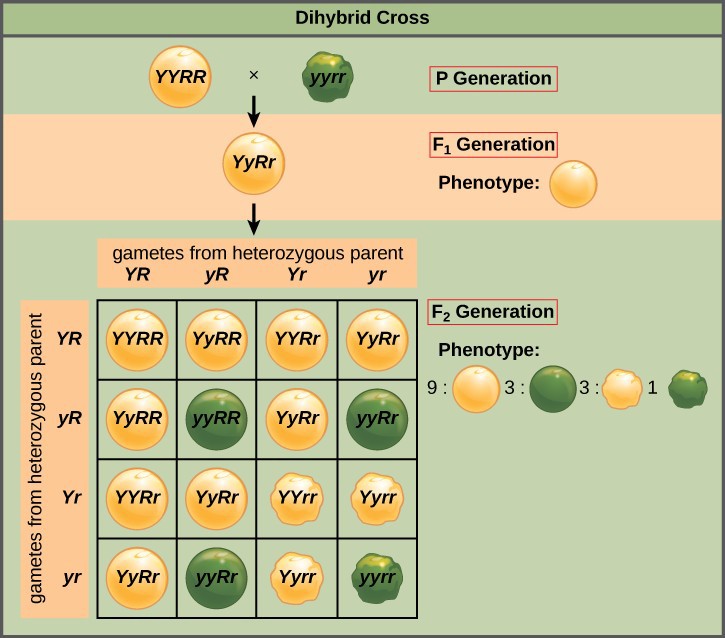
Mendel’s principle of independent assortment states that genes do not influence each other with regard to the sorting of alleles into gametes, and every possible combination of alleles for every gene is equally likely to occur. The independent assortment of genes can be illustrated by a dihybrid cross, a cross between two true-breeding parents that express different traits for two characteristics. Consider the characteristics of seed color and seed texture for two pea plants, one that has green, wrinkled seeds (yyrr) and another that has yellow, round seeds (YYRR). Because each parent is homozygous, the principle of segregation indicates that the gametes for the green/wrinkled plant all are yr, and the gametes for the yellow/round plant are all YR. Therefore, the F1 generation of offspring all are YyRr (Figure 18.9).
For the F2 generation, the principle of segregation requires that each gamete receive either an R allele or an r allele along with either a Y allele or a y allele. The principle of independent assortment states that a gamete into which an r allele sorted would be equally likely to contain either a Y allele or a y allele. Thus, there are four equally likely gametes that can be formed when the YyRr heterozygote is self-crossed, as follows: YR, Yr, yR, and yr. Arranging these gametes along the top and left of a 4 × 4 Punnett square gives us 16 equally likely genotypic combinations. From these genotypes, we infer a phenotypic ratio of 9 round/yellow:3 round/green:3 wrinkled/yellow:1 wrinkled/green (Figure 18.9).
The physical basis for the principle of independent assortment also lies in meiosis I, in which the different homologous pairs line up in random orientations. Each gamete can contain any combination of paternal and maternal chromosomes (and therefore the genes on them) because the orientation of tetrads on the metaphase plane is random.
Testing the Hypothesis of Independent Assortment
To better appreciate the amount of labor and ingenuity that went into Mendel’s experiments, proceed through one of Mendel’s dihybrid crosses.
Question: What will be the offspring of a dihybrid cross?
Background: Consider that you have access to a large garden in which you can cultivate thousands of pea plants. There are several true-breeding plants with the following pairs of traits: tall plants with inflated pods, and dwarf plants with constricted pods. Before the plants have matured, you remove the pollen-producing organs from the tall/inflated plants in your crosses to prevent self-fertilization. When the plants mature, they are manually crossed by transferring pollen from the dwarf/constricted plants to the stigmata of the tall/inflated plants.
Hypothesis: Both trait pairs will sort independently according to Mendelian principles. When the true-breeding parents are crossed, all of the F1 offspring are tall and have inflated pods, which indicates that the tall (T ) and inflated (I) traits are dominant over the dwarf (t) and constricted (i) traits, respectively. A self-cross of the F1 heterozygotes results in 2,000 F2 progeny.
Test the hypothesis: You cross the dwarf and tall plants and then self-cross the offspring. For best results, this is repeated with hundreds or even thousands of pea plants. What special precautions should be taken in the crosses and in growing the plants?
If these traits sort independently, the ratios of tall:dwarf and inflated:constricted will each be 3:1. Each member of the F1 generation therefore has a genotype of TtIi. Figure 18.10 shows a cross between two TtIi individuals. There are 16 possible offspring genotypes. The offspring proportions: tall/inflated:tall/constricted:dwarf/inflated:dwarf/constricted show a 9:3:3:1 ratio. Notice from the grid that when considering the tall/dwarf and inflated/constricted trait pairs in isolation, they are each inherited in 3:1 ratios.
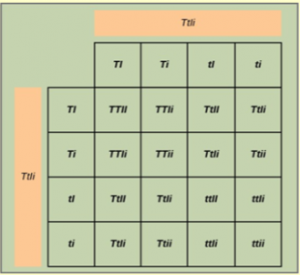
Analyze your data: You observe the following plant phenotypes in the F2 generation: 2706 tall/inflated, 930 tall/constricted, 888 dwarf/inflated, and 300 dwarf/constricted. Reduce these findings to a ratio and determine if they are consistent with Mendelian principles.
Form a conclusion: Were the results close to the expected 9:3:3:1 phenotypic ratio? Do the results support the prediction? What might be observed if far fewer plants were used, given that alleles segregate randomly into gametes? Try to imagine growing that many pea plants, and consider the potential for experimental error. For instance, what would happen if it was extremely windy one day?
18.3 | Exceptions to Mendel’s Principles of Inheritance
Learning Objectives
By the end of this section, you will be able to:
- Identify non-Mendelian inheritance patterns such as incomplete dominance, codominance, and sex linkage.
- Describe genetic linkage.
- Describe how chromosome maps are created.
- Explain the phenotypic outcomes of epistatic effects between genes.
Although Mendel’s principles still apply to some situations, many situations exist in which they do not apply. These “exceptions” to Mendelian genetics are discussed below.
18.3.1 Alternatives to Dominance and Recessiveness
Since Mendel’s experiments with pea plants, other researchers have found that the principle of dominance does not always hold true. Instead, several different patterns of inheritance have been found to exist.
Incomplete Dominance
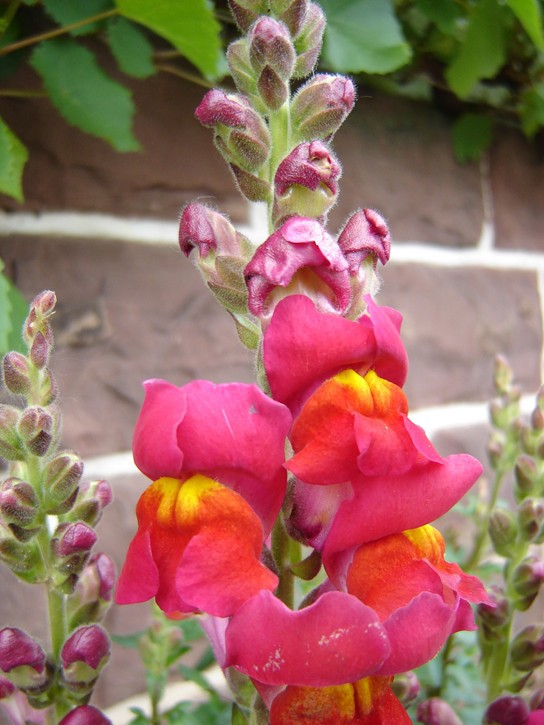
Mendel’s results, that traits are inherited as dominant and recessive pairs, contradicted the view at that time that offspring exhibited a blend of their parents’ traits. However, the heterozygote phenotype occasionally does appear to be intermediate between the two parents. For example, in the snapdragon, Antirrhinum majus (Figure 18.11), a cross between a homozygous parent with white flowers (CWCW) and a homozygous parent with red flowers (CRCR) will produce offspring with pink flowers (CRCW). (Note that different genotypic abbreviations are used for Mendelian extensions to distinguish these patterns from simple dominance and recessiveness.) This pattern of inheritance is described as incomplete dominance, denoting the expression of two contrasting alleles such that the individual displays an intermediate phenotype. The allele for red flowers is incompletely dominant over the allele for white flowers. However, the results of a heterozygote self-cross can still be predicted, just as with Mendelian dominant and recessive crosses. In this case, the genotypic ratio would be 1 CRCR:2 CRCW:1 CWCW, and the phenotypic ratio would be 1:2:1 for red:pink:white.
Codominance
A variation on incomplete dominance is codominance, in which both alleles for the same characteristic are simultaneously expressed in the heterozygote. An example of codominance is the MN blood groups of humans. The M and N alleles are expressed in the form of an M or N antigen present on the surface of red blood cells. Homozygotes (LMLM and LNLN) express either the M or the N allele, and heterozygotes (LMLN) express both alleles equally. In a self-cross between heterozygotes expressing a codominant trait, the three possible offspring genotypes are phenotypically distinct. However, the 1:2:1 genotypic ratio characteristic of a Mendelian monohybrid cross still applies.
Multiple Alleles
Mendel implied that only two alleles, one dominant and one recessive, could exist for a given gene. We now know that this is an oversimplification. Although individual humans (and all diploid organisms) can only have two alleles for a given gene, multiple alleles may exist at the population level such that many combinations of two alleles are observed. Note that when many alleles exist for the same gene, the convention is to denote the most common phenotype or genotype among wild animals as the wild type (often abbreviated “+”); this is considered the standard or norm. All other phenotypes or genotypes are considered variants of this standard, meaning that they deviate from the wild type. The variant may be recessive or dominant to the wild-type allele.
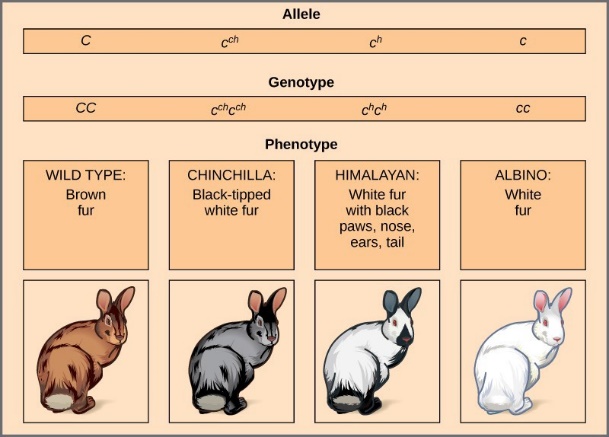
An example of multiple alleles is coat color in rabbits (Figure 18.12). Here, four alleles exist for the c gene. The wild-type version, C+C+, is expressed as brown fur. The chinchilla phenotype, cchcch, is expressed as black-tipped white fur. The Himalayan phenotype, chch, has black fur on the extremities and white fur elsewhere. Finally, the albino, or “colorless” phenotype, cc, is expressed as white fur. In cases of multiple alleles, dominance hierarchies can exist. In this case, the wild- type allele is dominant over all the others, chinchilla is incompletely dominant over Himalayan and albino, and Himalayan is dominant over albino. This hierarchy, or allelic series, was revealed by observing the phenotypes of each possible heterozygote offspring.
An example of multiple allelism in humans pertains to ABO blood type. A person’s blood type (e.g., type A or type O) is caused by different combinations of three alleles: IA, IB, and IO. A person with type A blood could have either IAIA or IAIO genotype. A person with type B blood could have IBIB or IBIO genotype. A person with type O blood must have the IOIO genotype. Note that type AB blood is an example of codominance (IAIB).
The complete dominance of a wild-type phenotype over all other mutants often occurs as an effect of “dosage” of a specific gene product, such that the wild-type allele supplies the correct amount of gene product whereas the mutant alleles cannot. For rabbit fur color, the wild-type allele may supply a given dosage of fur pigment, whereas the mutants supply a lesser dosage or none at all.
Multiple Alleles Confer Drug Resistance in the Malaria Parasite
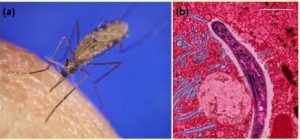
Malaria is a parasitic disease that is transmitted to humans by infected female Anopheles gambiae mosquitos (Figure 18.13a). It is characterized by cyclic high fevers, chills, flu-like symptoms, and severe anemia. Plasmodium falciparum is the most deadly causative agent of malaria (Figure 18.13b). When promptly and correctly treated, P. falciparum malaria has a mortality rate of 0.1%. However, in some parts of the world, the parasite has evolved resistance to commonly used malaria treatments, so the most effective malarial treatments can vary by geographic region.
In Southeast Asia, Africa, and South America, P. falciparum has developed resistance to the anti-malarial drugs chloroquine, mefloquine, and sulfadoxine-pyrimethamine. P. falciparum, which is haploid during the life stage in which it infects humans, has evolved multiple drug-resistant mutant alleles of the dhps gene. Varying degrees of sulfadoxine resistance are associated with each of these alleles. Being haploid, P. falciparum needs only one drug-resistant allele to express this trait.
In Southeast Asia, different sulfadoxine-resistant alleles of the dhps gene are localized to different geographic regions. This is a common evolutionary phenomenon that occurs because drug-resistant mutants arise in a population and interbreed with other P. falciparum isolates in close proximity. Sulfadoxine-resistant parasites cause considerable human hardship in regions where this drug is widely used as an over-the-counter malaria remedy. As is common with pathogen that multiply to large numbers within an infection cycle, P. falciparum evolves relatively rapidly (over a decade or so) in response to the selective pressure of commonly used anti-malarial drugs. For this reason, scientists must constantly work to develop new drugs or drug combinations to combat the worldwide malaria burden.
Environmental Effects
Interestingly, the Himalayan phenotype in rabbits is the result of an allele that produces a temperature-sensitive gene product that only produces pigment in the cooler extremities of the rabbit’s body. In this case, the protein product of the gene does not fold correctly at high temperatures. A similar gene gives Siamese cats their distinctive coloration.
Temperature-sensitive proteins are also at work in arctic foxes and rabbits, which are white in the winter and darker colored during the summer. In these cases, the protein product of the gene does not fold correctly at colder temperatures. The mutation that caused this coloration was advantageous to these species, so they persisted in the populations.
18.3.2 X-Linked Traits are an Exception to the Principle of Segregation
In humans, as well as in many other animals and some plants, the sex of the individual is determined by sex chromosomes. The sex chromosomes are one pair of non-homologous chromosomes. Until now, we have only considered inheritance patterns among non-sex chromosomes, or autosomes. In addition to 22 homologous pairs of autosomes, human females have a homologous pair of X chromosomes, whereas human males have an XY chromosome pair. Although the Y chromosome contains a small region of similarity to the X chromosome so that they can pair during meiosis, the Y chromosome is much shorter and contains many fewer genes. When a gene is present on the X chromosome, it is said to be X-linked.
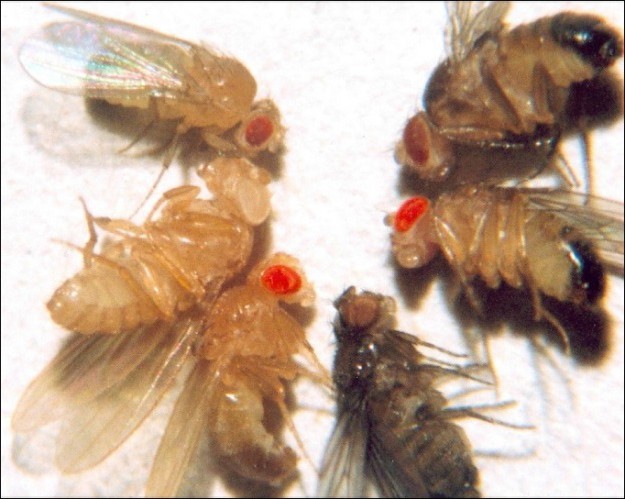
Eye color in Drosophila was one of the first X-linked traits to be identified. Like humans, Drosophila males are XY and females are XX. In flies, the wild-type eye color is red (XW) which is dominant to white eye color (Xw) (Figure 18.14). Females can be XWXW, XWXw or XwXw. However, Drosophila males lack a second allele copy on the Y chromosome, so their genotype can only be XWY or XwY. Males are said to be hemizygous, because they have only one allele for any X- linked characteristic. Hemizygosity makes the descriptions of dominance and recessiveness irrelevant for XY males.
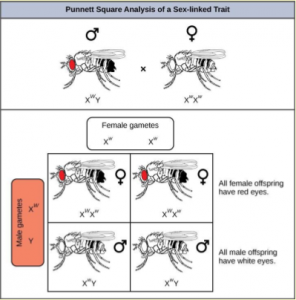
In an X-linked cross, the genotypes of F1 and F2 offspring depend on whether the recessive trait was expressed by the male or the female in the P generation. When the P male expresses the white-eye phenotype and the female is homozygous red-eyed, all members of the F1 generation exhibit red eyes (Figure 18.15). The F1 females are heterozygous (XWXw), and the males are all XWY, since they received their X chromosome from the homozygous dominant P female and their Y chromosome from the P male. A cross between a XWXw female and an XWY male would produce only red-eyed females and both red- and white-eyed males. A cross between a homozygous white-eyed female and a male with red eyes would produce only heterozygous red-eyed females and only white-eyed males.
Concept Check
What ratio of offspring would result from a cross between a white-eyed male and a female that is heterozygous for red eye color?
In some groups of organisms with sex chromosomes, the gender with the non-homologous sex chromosomes is the female rather than the male. This is the case for all birds. In this case, sex-linked traits will be more likely to appear in the female, in which they are hemizygous.
Human Sex-linked Disorders
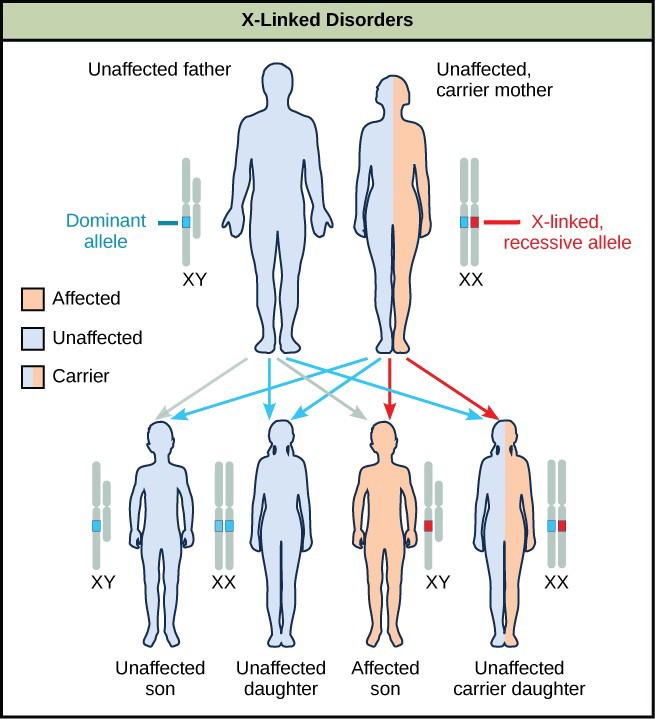
Sex-linkage studies in Morgan’s laboratory provided the fundamentals for understanding X-linked recessive disorders in humans, which included red-green color blindness, Types A and B hemophilia, and muscular dystrophy. Because human males need to inherit only one recessive mutant X allele to be affected, X-linked disorders are disproportionately observed in males. Females must inherit recessive X-linked alleles from both of their parents in order to express the trait. When they inherit one recessive X-linked mutant allele and one dominant X-linked wild-type allele, they are carriers of the trait and are typically unaffected. Carrier females can manifest mild forms of the trait due to the inactivation of the dominant allele located on one of the X chromosomes. However, female carriers can contribute the trait to their sons, resulting in the son exhibiting the trait, or they can contribute the recessive allele to their daughters, resulting in the daughters being carriers of the trait (Figure 18.16). Although some Y-linked recessive disorders exist, typically they are associated with infertility in males and are therefore not transmitted to subsequent generations.
18.3.3 Lethal Alleles are Apparent Exceptions to the Principle of Segregation

A large proportion of genes in an individual’s genome are essential for survival. Occasionally, a nonfunctional allele for an essential gene can arise by mutation and be transmitted in a population through heterozygous carriers. The wild-type allele functions at a capacity sufficient to sustain life and is therefore considered to be dominant over the nonfunctional allele. If two heterozygous parents mate, one quarter of their offspring will be homozygous recessive. Because the gene is essential, these individuals will die. This will cause the genotypic ratio among surviving offspring to be 2:1 rather than 3:1. This inheritance pattern is referred to as recessive lethal.
The dominant lethal inheritance pattern is one in which an allele is lethal both in the homozygote and the heterozygote. Dominant lethal alleles are very rare because, as you might expect, the allele only lasts one generation and is not transmitted. However, dominant lethal alleles might not be expressed until adulthood. The allele may be unknowingly passed on, resulting in a delayed death in both generations. An example of this in humans is Huntington disease, in which the nervous system gradually wastes away (Figure 18.17). People who are heterozygous for the dominant Huntington allele (Hh) will inevitably develop the fatal disease. However, the onset of Huntington disease may not occur until age 40, at which point the afflicted persons may have already passed the allele to 50 percent of their offspring.
18.3.4 Linked Genes Violate the Principle of Independent Assortment
Although all of Mendel’s pea characteristics behaved according to the principle of independent assortment, we now know that some allele combinations are not inherited independently of each other. Genes that are located on different chromosomes will always sort independently. However, each chromosome contains hundreds or thousands of genes, organized linearly on chromosomes like beads on a string. Genes that are on the same chromosome are linked and are therefore likely to be inherited together. When homologs separate during meiosis I, entire chromosomes segregate into separate daughter cells, carrying all of their linked genes with them.
However, because of crossover, it is possible for two genes on the same chromosome to behave independently, or as if they are not linked. To understand this, let’s consider the biological basis of gene linkage and recombination.
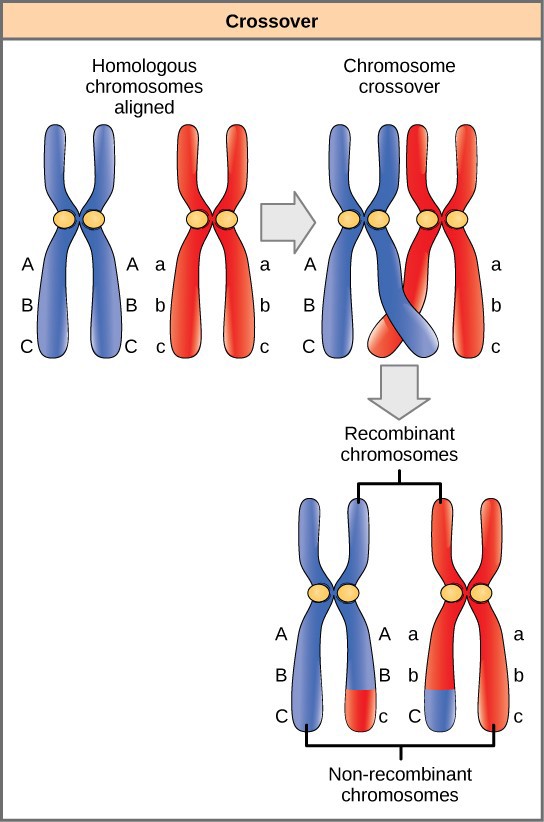
Homologous chromosomes possess the same genes in the same order. However, since each homolog came from a different parent, the alleles may differ on homologous chromosome pairs. Prior to meiosis I, homologous chromosomes replicate and synapse so that genes on the homologs align with each other. At this stage, segments of homologous chromosomes cross over and exchange segments of genetic material (Figure 18.18). Because the genes are aligned, the gene order is not altered. Instead, the result of recombination is that maternal and paternal alleles are combined onto the same chromosome. Across a given chromosome, several recombination events may occur, causing extensive shuffling of alleles.
When two genes are located in close proximity on the same chromosome, their alleles are more likely to be transmitted through meiosis together. To exemplify this, imagine a dihybrid cross involving flower color and plant height in which the genes are next to each other on the chromosome. If the homologous chromosome from one parent has alleles for tall plants and red flowers, and the homolog from the other parent has alleles for short plants and yellow flowers, then when the gametes are formed, the tall and red alleles will go together into a gamete and the short and yellow alleles will go into other gametes. These are called the parental genotypes because they have been inherited intact from the parents of the individual producing gametes. Since the genes were close together on the same chromosomes, the chance of a crossover event happening between them is slim. Therefore, there will be no gametes with tall and yellow alleles and no gametes with short and red alleles. If you create the Punnett square with these gametes, you will see that the classical Mendelian prediction of a 9:3:3:1 outcome of a dihybrid cross would not apply
As the distance between two genes increases, the probability of crossovers between them increases, and the genes behave more as if they are on separate chromosomes. The further apart two linked genes are on a chromosome, the more progeny with nonparental genotypes will appear.
Genetic Linkage and Distances
Geneticists have used the proportion of nonparental gametes as a measure of how far apart genes are on a chromosome. Using this information, they have constructed elaborate maps of genes on chromosomes. Briefly, the more crossover that occurs between two linked genes, the further apart they are on the chromosome. The frequency of crossover is measured by counting the number of offspring that have nonparental genotypes. By using recombination frequency to predict genetic distance, the relative order of genes on chromosome 2 could be inferred.
18.3.5 Epistasis is an Exception to the Principle of Independent Assortment
Mendel’s studies in pea plants implied that every characteristic was distinctly and completely controlled by a single gene. In fact, single observable characteristics are almost always under the influence of multiple genes (each with two or more alleles) acting in unison. For example, at least eight genes contribute to eye color in humans.
Genes may function in complementary or synergistic fashions, such that two or more genes need to be expressed simultaneously to affect a phenotype. Genes may also oppose each other. In epistasis, the interaction between genes is antagonistic, such that one gene masks or interferes with the expression of another. Often the biochemical basis of epistasis is a gene pathway in which the expression of one gene is dependent on the function of a gene that precedes or follows it in the pathway.
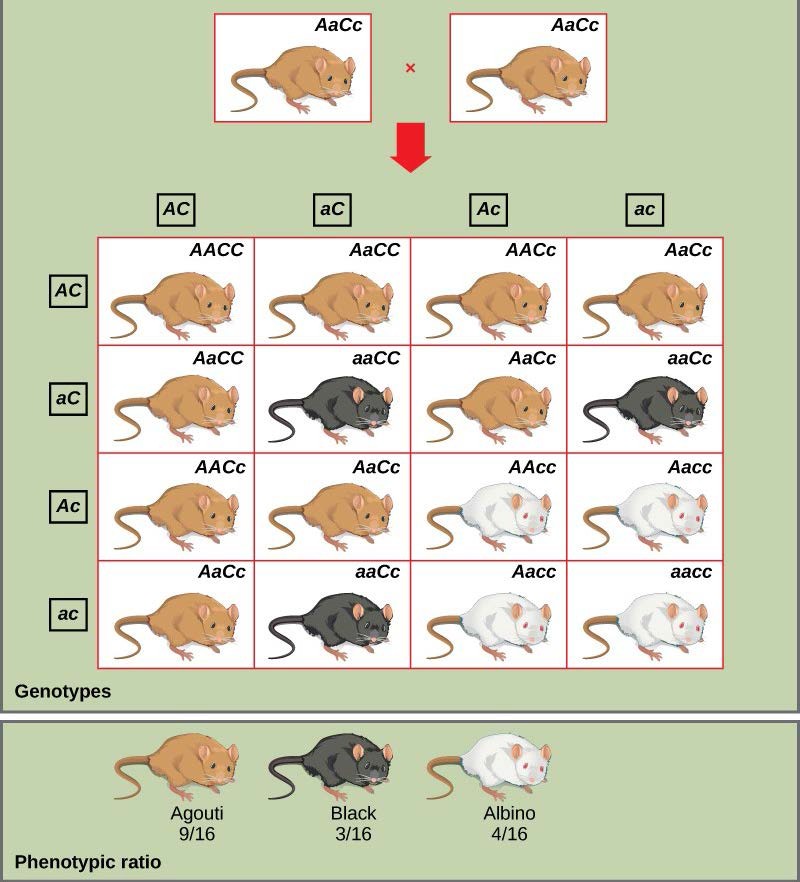
An example of epistasis is pigmentation in mice. The wild-type coat color, agouti (AA), is dominant to solid-colored fur (aa). However, a separate gene (C) is necessary for pigment production. A mouse with a recessive c allele at this locus is unable to produce pigment and is albino regardless of the allele present at locus A. Therefore, the genotypes AAcc, Aacc, and aacc all produce an albino phenotype. A cross between heterozygotes for both genes (AaCc x AaCc) would generate offspring with a phenotypic ratio of 9 agouti:3 solid color:4 albino (Figure 18.19). In this case, the C gene is epistatic to the A gene.
Epistasis can also occur when a dominant allele masks expression at a separate gene. Fruit color in summer squash is expressed in this way. Homozygous recessive expression of the W gene (ww) coupled with homozygous dominant or heterozygous expression of the Y gene (YY or Yy) generates yellow fruit, and the wwyy genotype produces green fruit. However, if a dominant copy of the W gene is present in the homozygous or heterozygous form, the summer squash will produce white fruit regardless of the Y alleles. A cross between white heterozygotes for both genes (WwYy × WwYy) would produce offspring with a phenotypic ratio of 12 white:3 yellow:1 green.
Finally, epistasis can be reciprocal such that either gene, when present in the dominant (or recessive) form, expresses the same phenotype. In the shepherd’s purse plant (Capsella bursa-pastoris), the characteristic of seed shape is controlled by two genes in a dominant epistatic relationship. When the genes A and B are both homozygous recessive (aabb), the seeds are ovoid. If the dominant allele for either of these genes is present, the result is triangular seeds. That is, every possible genotype other than aabb results in triangular seeds, and a cross between heterozygotes for both genes (AaBb x AaBb) would yield offspring with a phenotypic ratio of 15 triangular:1 ovoid.
As you work through genetics problems, keep in mind that any single characteristic that results in a phenotypic ratio that totals 16 is typical of a two-gene interaction. Recall the phenotypic inheritance pattern for Mendel’s dihybrid cross, which considered two non-interacting genes—9:3:3:1. Similarly, we would expect interacting gene pairs to also exhibit ratios expressed as 16 parts. Note that we are assuming the interacting genes are not linked; they are still assorting independently into gametes.
- Johann Gregor Mendel, Versuche über Pflanzenhybriden Verhandlungen des naturforschenden Vereines in Brünn, Bd. IV für das Jahr, 1865 Abhandlungen, 3–47. [for English translation see http://www.mendelweb.org/Mendel.plain.html] ↵
