
1.4 Mapping the Seafloor
The previous sections included some information on the depths of the oceans in various places. So how are we able to map the ocean floor to ascertain these vast depths?
To map the ocean floor we need to know the depth at a number of places. The process of measuring the depths is known as bathymetry. These measurements were first made through soundings, where a weighted line (lead line) was let out by hand until it touched the bottom, and the depth could be recorded from the length of the line (Figure 1.4.1). This technique led to the fathom as a unit of depth; as sailors hauled in the sounding line they would stretch it out to cover their arm span. The average arm span of a sailor was about six feet, so one fathom equals six feet, and the sailors could simply count the number of “arm spans” as they pulled in the line.
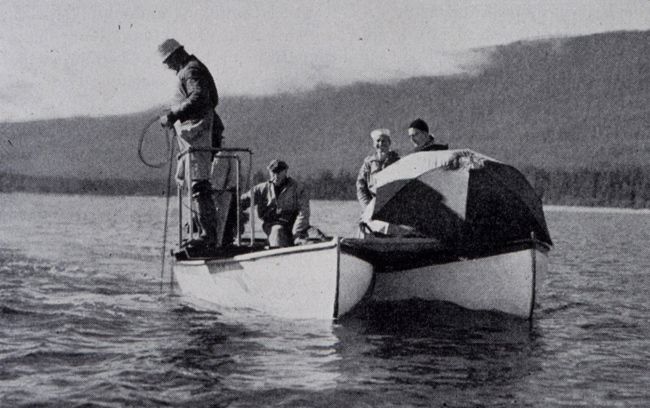
This technique had a number of drawbacks, and was usually limited to shallower water. It was very time consuming, and only gave depth data for a single point, so many individual soundings were needed to map an area. It could also be error-prone; in deep water it could be difficult to determine when the weight hit the bottom as the weight of the line itself could cause the line to keep sinking, and currents could deflect the line away from vertical, thus overestimating the depth. In later years, winches and heavy steel cables were used for deeper water, but this did not solve all of the problems inherent in the sounding method, and also added the constraint of excessive weight of the equipment.
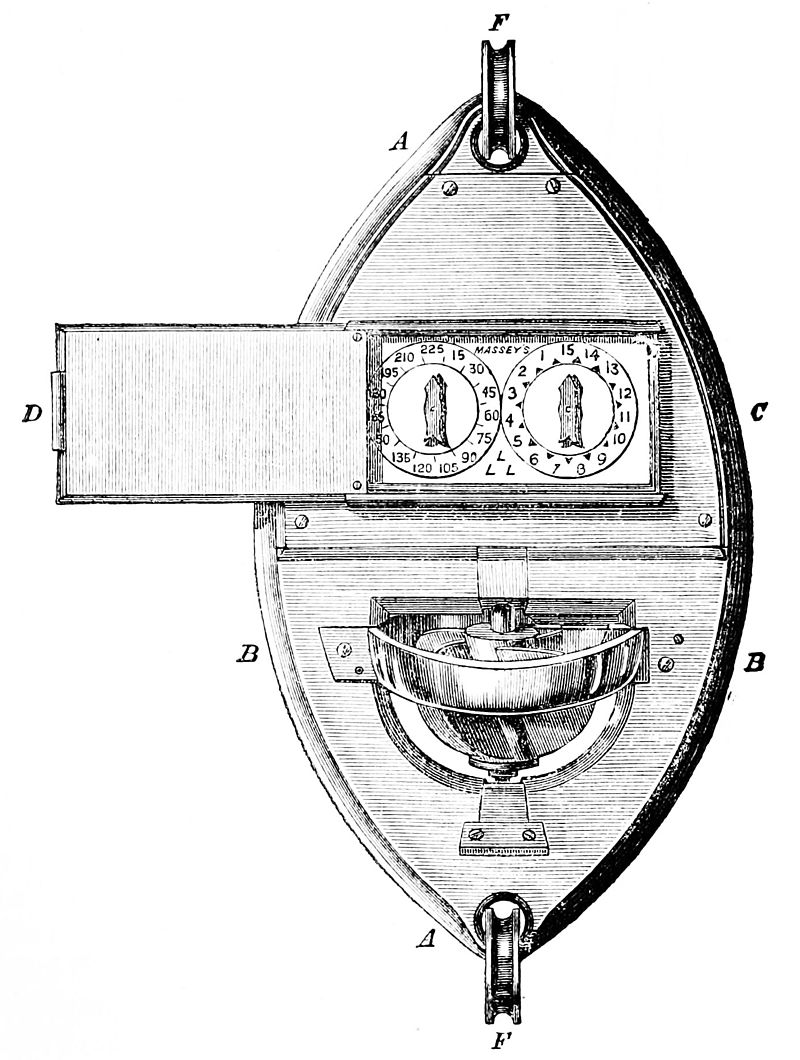
In the 19th century, a number of modifications were made to this simple design. In 1802 the British clockmaker Edward Massey invented a mechanical device that was attached to the sounding line; as the device sank, a rotor turned a dial which locked in place when the line hit bottom (Figure 1.4.2). The line could then be reeled in and the depth read from the dial. In 1853 American sailor John Mercer Brooke developed a cannonball weight attached to a twine reel. The cannonball was dropped over the side and allowed to free-fall to the bottom; by timing the fall rate (the rate at which the twine unspooled) and noting when the rate changed as the cannonball hit the bottom, the water depth could be calculated. When it hit bottom, the cannonball was released and the line could be hauled back in, bringing with it a sample of mud in the iron bar that held the cannonball, thus confirming that the bottom had been reached.
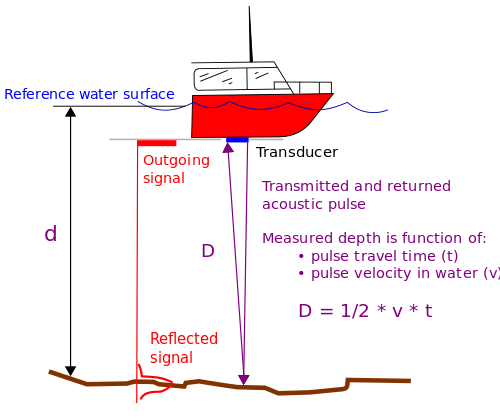
After the Titanic disaster in 1912, there was an effort to develop better methods of detecting icebergs from a ship. This led to the development of sonar (SOund Navigation And Ranging) technology, which was soon applied to mapping bathymetry. A sonar device called an echosounder sends out a pulse of sound, then listens for the returning echo. The timing of the returning echo is used to calculate depth. We know that the speed of sound in water is approximately 1500 m/s (see section 6.4). Since the returning echo traveled to the bottom and back, the water depth corresponds to half the time it takes for an echo to return, multiplied by the speed of sound in water (Figure 1.4.3):
depth=1/2*(two-way travel time)*(speed of sound in water)
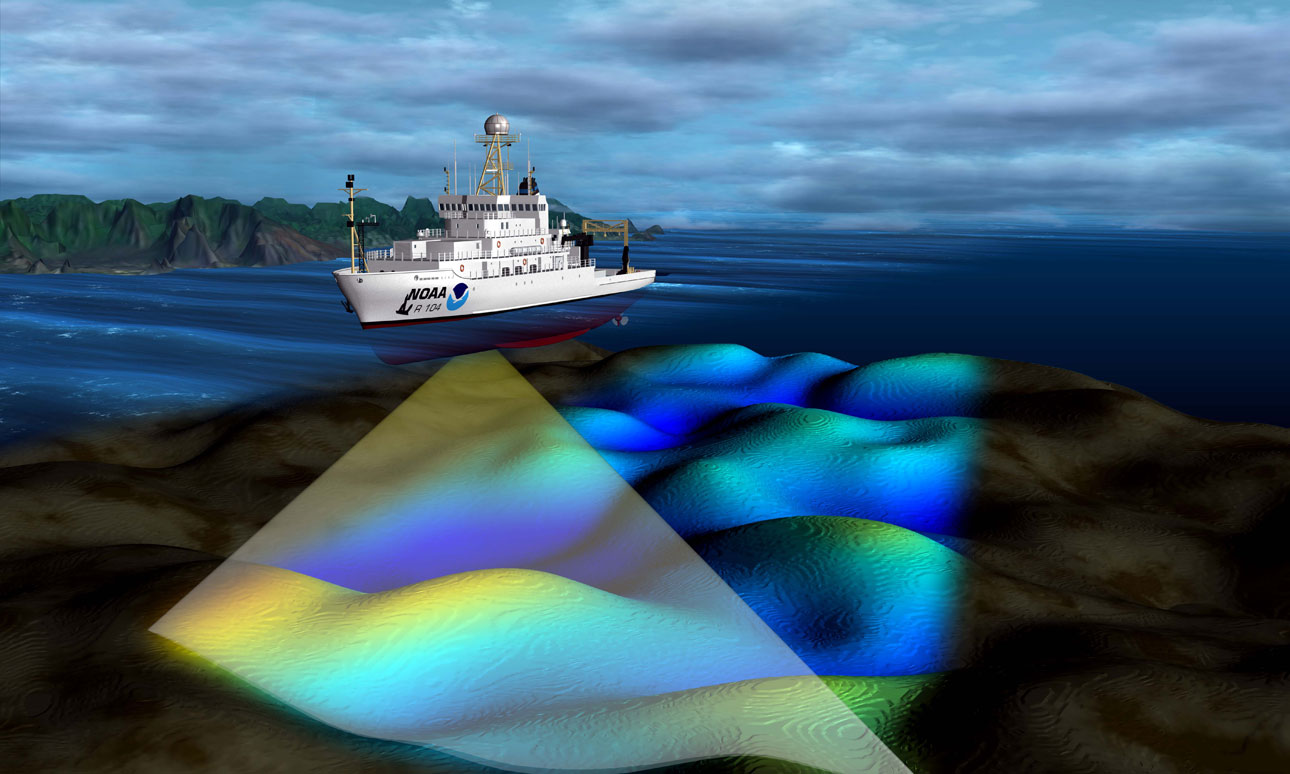
Echosounders allowed a fast, continuous record of bathymetry under a moving ship. However, they only give the depth directly under a ship’s path. Today, high resolution seafloor maps are made through multibeam or side scan sonar, either from a ship or from a towed transmitter (Fig. 1.4.4). Multibeam sonar produces a fan-shaped acoustic field allowing a much a wider area (>10 km wide) to be mapped simultaneously.
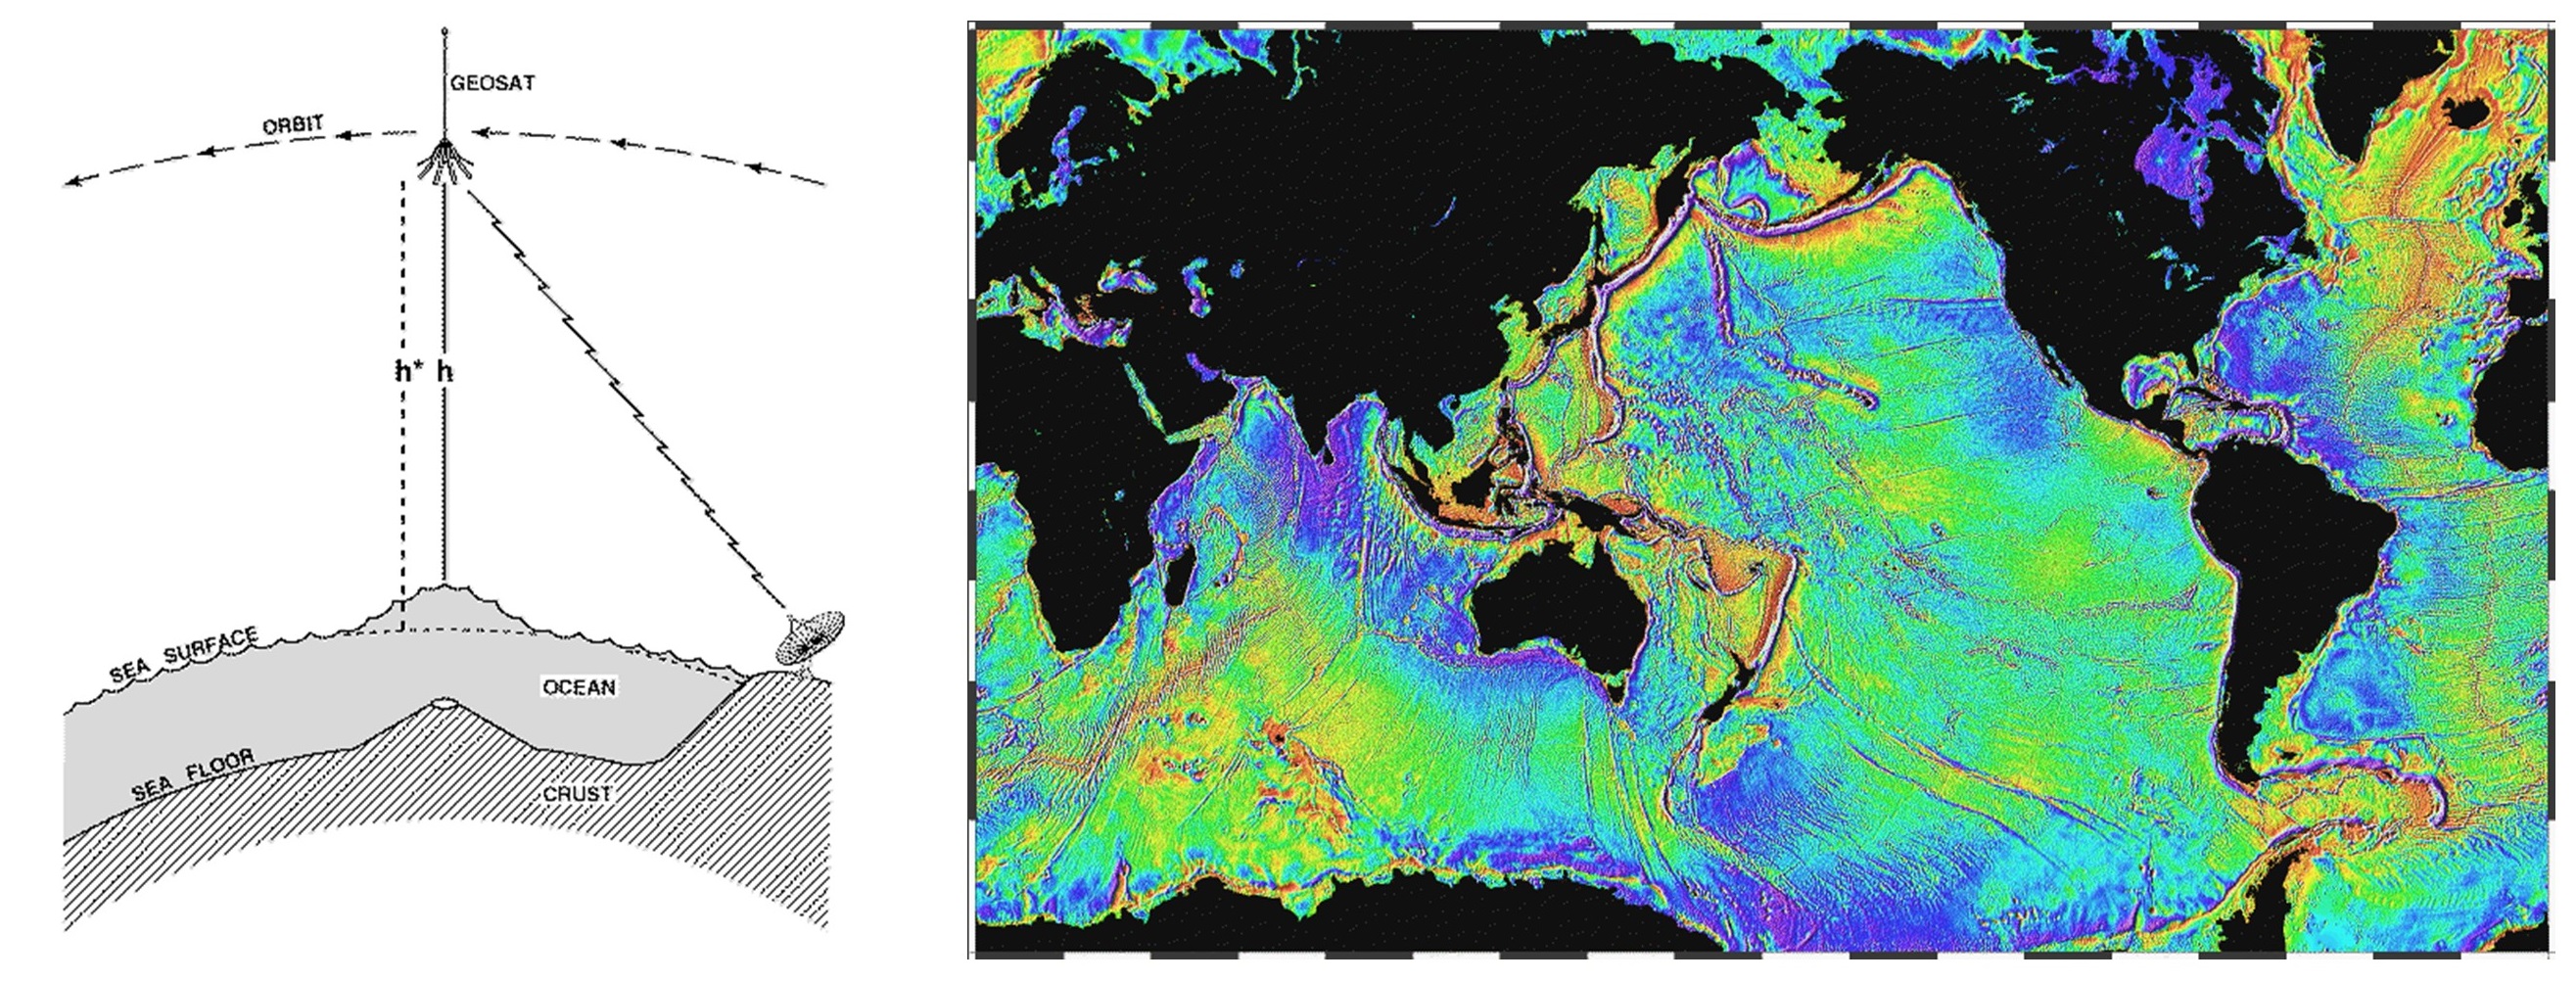
Large-scale mapping of the ocean floor is also carried out by satellites (originally SEASAT, then GEOSAT, now the Jason satellites) which use radio waves to measure the height of the sea surface (radar altimetry). The sea surface is not flat; gravity causes it to be slightly higher over elevated features on the ocean floor, and slightly lower over trenches and other depressions. Satellites send out radio waves, and similar to an echosounder, can use the returning waves to detect differences in sea surface height down to 3-6 cm (Figure 1.4.5). These differences in sea surface heights allow us to determine the topography under the surface. Unlike the old lead line technology, where hundreds of soundings were necessary to map a small area, each taking an hour or more to complete, the current satellites can map over 90% of Earth’s ice-free sea surface every 10 days!
Scientist Spotlight: Marie Tharp
Watch this short video to learn how Marie Tharp became a pioneer in mapping the seafloor and provided important evidence for the theory of plate tectonics.
Additional links for more information:
- NOAA page on side scan sonar: https://oceanexplorer.noaa.gov/technology/sonar/side-scan.html
- NOAA page on exploring the ocean using satellite altimetry data: https://oceanservice.noaa.gov/facts/satellites-ocean.html
- NASA animations showing how the land masses of Earth would change if the oceans were drained: https://svs.gsfc.nasa.gov/4823
pertains to measuring the depths of the ocean (1.4)
a single measurement of ocean depth (1.4)
acronym for sound navigation and ranging; a method of using sound echoes to detect objects (1.4)
