
4.5 Divergent Plate Boundaries
Modified from "Physical Geology" by Steven Earle*
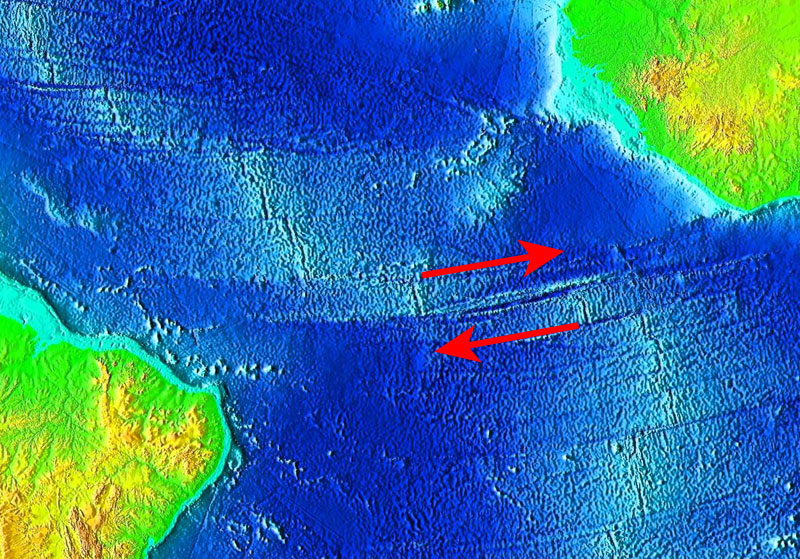
Divergent boundaries are spreading boundaries, where new oceanic crust is created to fill in the space as the plates move apart. Most divergent boundaries are located along mid-ocean oceanic ridges (although some are on land). The mid-ocean ridge system is a giant undersea mountain range, and is the largest geological feature on Earth; at 65,000 km long and about 1000 km wide, it covers 23% of Earth’s surface (Figure 4.5.1). Because the new crust formed at the plate boundary is warmer than the surrounding crust, it has a lower density so it sits higher on the mantle, creating the mountain chain. Running down the middle of the mid-ocean ridge is a rift valley 25-50 km wide and 1 km deep. Although oceanic spreading ridges appear to be curved features on Earth’s surface, in fact the ridges are composed of a series of straight-line segments, offset at intervals by faults perpendicular to the ridge, called transform faults. These transform faults make the mid-ocean ridge system look like a giant zipper on the seafloor (Figure 4.5.2). As we will see in section 4.7, movements along transform faults between two adjacent ridge segments are responsible for many earthquakes.
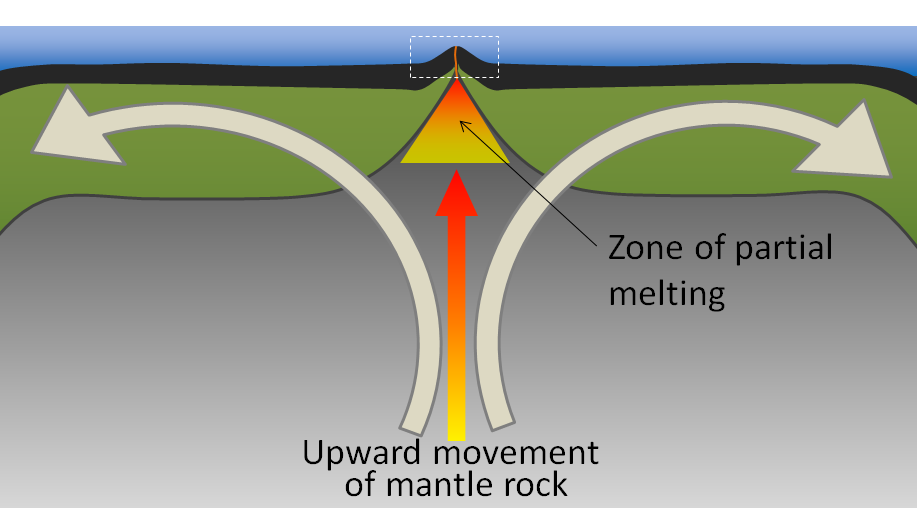
The crustal material created at a spreading boundary is always oceanic in character; in other words, it is igneous rock (e.g., basalt or gabbro, rich in ferromagnesian minerals), forming from magma derived from partial melting of the mantle caused by decompression as hot mantle rock from depth is moved toward the surface (Figure 4.5.3). The triangular zone of partial melting near the ridge crest is approximately 60 km thick and the proportion of magma is about 10% of the rock volume, thus producing crust that is about 6 km thick. This magma oozes out onto the seafloor to form pillow basalts, breccias (fragmented basaltic rock), and flows, interbedded in some cases with limestone or chert. Over time, the igneous rock of the oceanic crust gets covered with layers of sediment, which eventually become sedimentary rock.
Spreading is hypothesized to start within a continental area with up-warping or doming of crust related to an underlying mantle plume or series of mantle plumes. The buoyancy of the mantle plume material creates a dome within the crust, causing it to fracture. When a series of mantle plumes exists beneath a large continent, the resulting rifts may align and lead to the formation of a rift valley (such as the present-day Great Rift Valley in eastern Africa). It is suggested that this type of valley eventually develops into a linear sea (such as the present-day Red Sea), and finally into an ocean (such as the Atlantic). It is likely that as many as 20 mantle plumes, many of which still exist, were responsible for the initiation of the rifting of Pangaea along what is now the mid-Atlantic ridge.
There are multiple lines of evidence demonstrating that new oceanic crust is forming at these seafloor spreading centers:
1. Age of the crust:
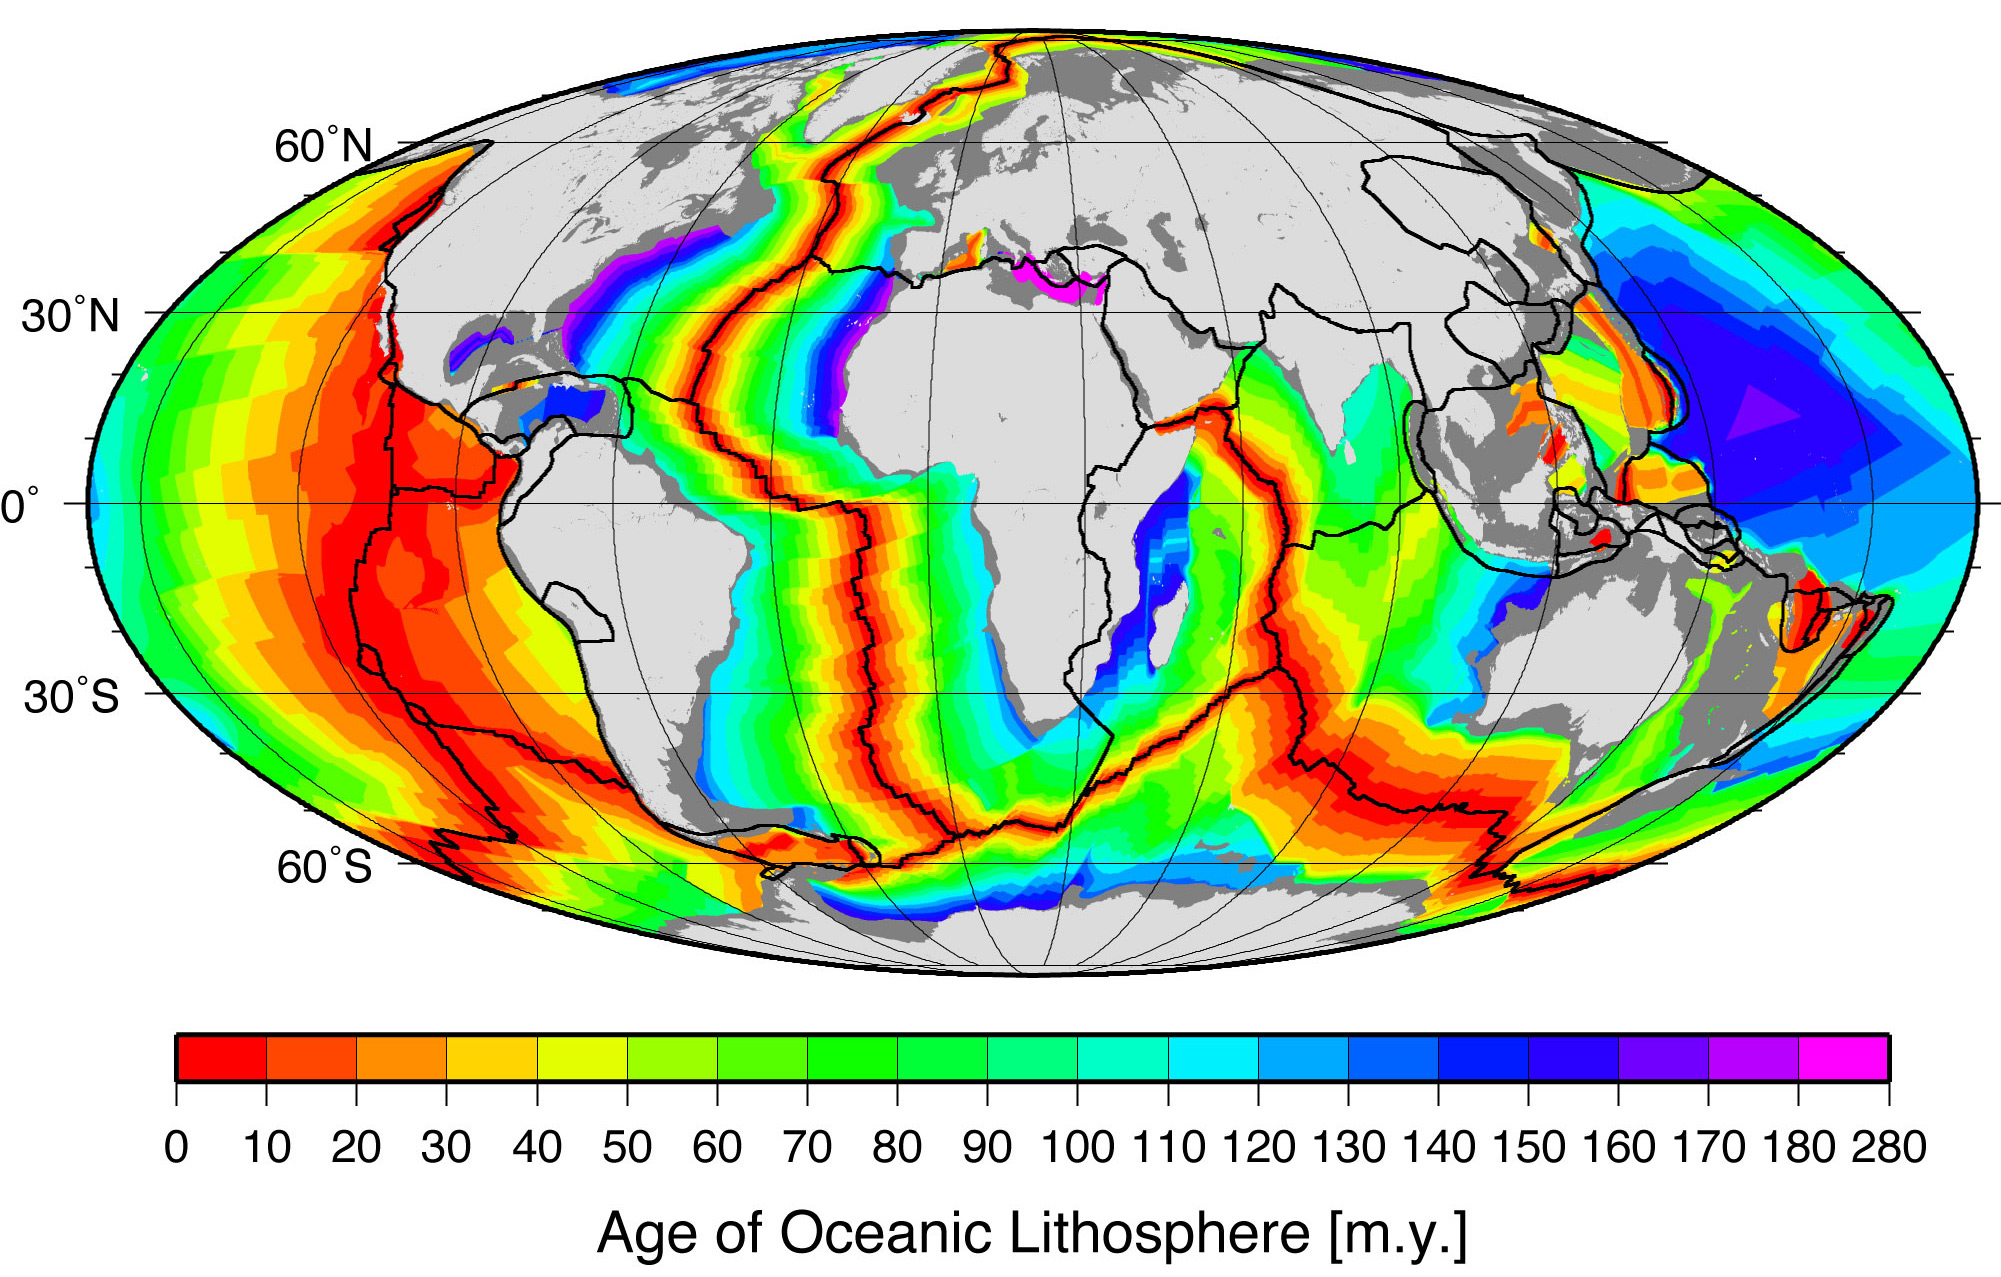
Comparing the ages of the oceanic crust near a mid-ocean ridge shows that the crust is youngest right at the spreading center, and gets progressively older as you move away from the divergent boundary in either direction, aging approximately 1 million years for every 20-40 km from the ridge. Furthermore, the pattern of crust age is fairly symmetrical on either side of the ridge (Figure 4.5.4).
The oldest oceanic crust is around 280 Ma in the eastern Mediterranean, and the oldest parts of the open ocean are around 180 Ma on either side of the north Atlantic. It may be surprising, considering that parts of the continental crust are close to 4,000 Ma old, that the oldest seafloor is less than 300 Ma. Of course, the reason for this is that all seafloor older than that has been either subducted (see section 4.6) or pushed up to become part of the continental crust. As one would expect, the oceanic crust is very young near the spreading ridges (Figure 4.5.4), and there are obvious differences in the rate of sea-floor spreading along different ridges. The ridges in the Pacific and southeastern Indian Oceans have wide age bands, indicating rapid spreading (approaching 10 cm/year on each side in some areas), while those in the Atlantic and western Indian Oceans are spreading much more slowly (less than 2 cm/year on each side in some areas).
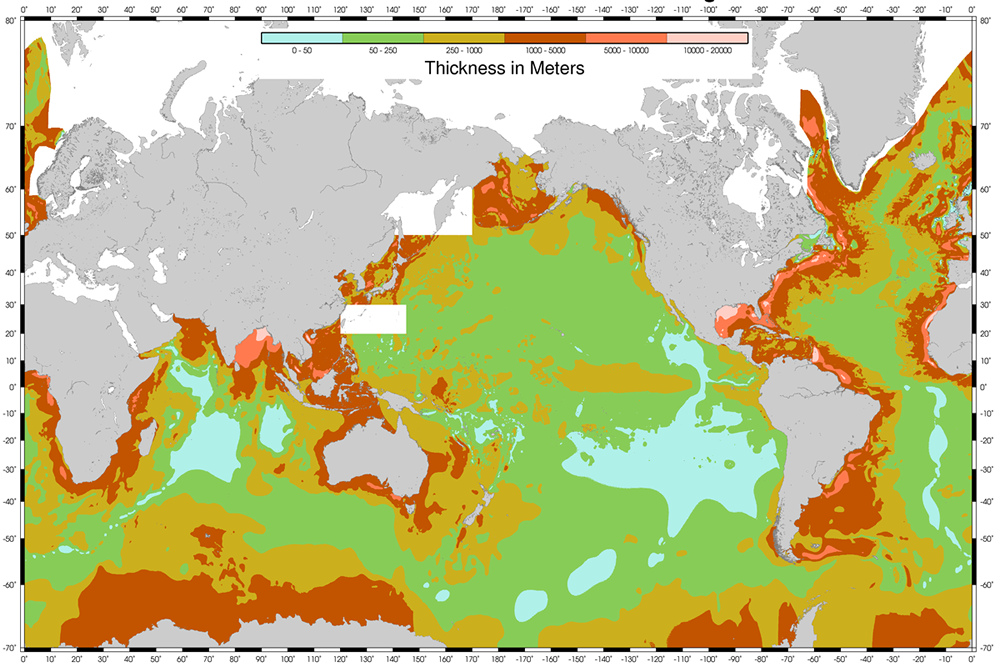
2. Sediment thickness:
With the development of seismic reflection sounding (similar to echo sounding described in section 1.4) it became possible to see through the seafloor sediments and map the bedrock topography and crustal thickness. Hence sediment thicknesses could be mapped, and it was soon discovered that although the sediments were up to several thousands of meters thick near the continents, they were relatively thin — or even non-existent — in the ocean ridge areas (Figure 4.5.5). This makes sense when combined with the data on the age of the oceanic crust; the farther from the spreading center the older the crust, the longer it has had to accumulate sediment, and the thicker the sediment layer. Additionally, the bottom layers of sediment are older the farther you get from the ridge, indicating that they were deposited on the crust long ago when the crust was first formed at the ridge.
3. Heat flow:
Measurements of rates of heat flow through the ocean floor revealed that the rates are higher than average (about 8x higher) along the ridges, and lower than average in the trench areas (about 1/20th of the average). The areas of high heat flow are correlated with upward convection of hot mantle material as new crust is formed, and the areas of low heat flow are correlated with downward convection at subduction zones.
4. Magnetic reversals:
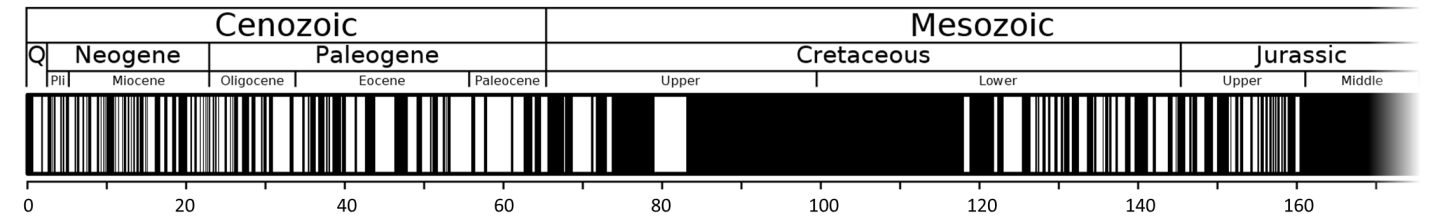
In section 4.2 we saw that rocks could retain magnetic information that they acquired when they were formed. However, Earth’s magnetic field is not stable over geological time. For reasons that are not completely understood, the magnetic field decays periodically and then becomes re-established. When it does re-establish, it may be oriented the way it was before the decay, or it may be oriented with the reversed polarity. During periods of reversed polarity, a compass would point south instead of north. Over the past 250 Ma, there have a few hundred magnetic field reversals, and their timing has been anything but regular. The shortest ones that geologists have been able to define lasted only a few thousand years, and the longest one was more than 30 million years, during the Cretaceous (Figure 4.5.6). The present “normal” event has persisted for about 780,000 years.
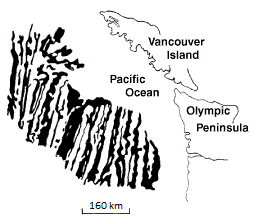
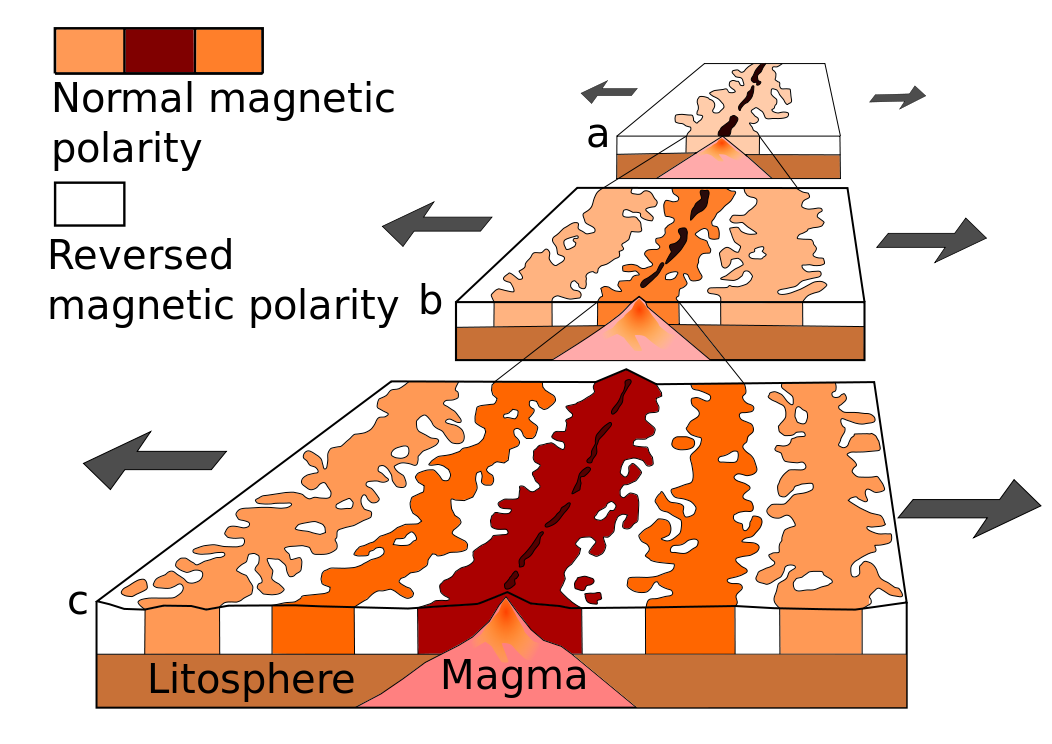
Beginning in the 1950s, scientists started using magnetometer readings when studying ocean floor topography. The first comprehensive magnetic data set was compiled in 1958 for an area off the coast of British Columbia and Washington State. This survey revealed a mysterious pattern of alternating stripes of low and high magnetic intensity in sea-floor rocks (Figure 4.5.7). Subsequent studies elsewhere in the ocean also observed these magnetic anomalies, and most importantly, the fact that the magnetic patterns are symmetrical with respect to ocean ridges. In the 1960s, in what would become known as the Vine-Matthews-Morley (VMM) hypothesis, it was proposed that the patterns associated with ridges were related to the magnetic reversals, and that oceanic crust created from cooling basalt during a normal event would have polarity aligned with the present magnetic field, and thus would produce a positive anomaly (a black stripe on the sea-floor magnetic map), whereas oceanic crust created during a reversed event would have polarity opposite to the present field and thus would produce a negative magnetic anomaly (a white stripe). The widths of the anomalies varied according to the spreading rates characteristic of the different ridges. This process is illustrated in Figure 4.5.8. New crust is formed (panel a) and takes on the existing normal magnetic polarity. Over time, as the plates continue to diverge, the magnetic polarity reverses, and new crust formed at the ridge now takes on the reversed polarity (white stripes in Figure 4.5.8). In panel b, the poles have reverted to normal, so once again the new crust shows normal polarity before moving away from the ridge. Eventually, this creates a series of parallel, alternating bands of reversals, symmetrical around the spreading center (panel c).
a plate boundary at which the two plates are moving away from each other (4.5)
the Earth’s crust underlying the oceans (as opposed to continental crust) (3.2)
an underwater mountain system along divergent plate boundaries, formed by plate tectonics (4.5)
the middle layer of the Earth, dominated by iron and magnesium rich silicate minerals and extending for about 2900 km from the base of the crust to the top of the core (3.2)
a valley created when crust subsides along a divergent plate boundary (4.5)
a type of fault in which two pieces of crust slide past one another (4.5)
a volcanic rock that makes up much of the oceanic crust (3.2)
molten rock typically dominated by silica (3.2)
unconsolidated particles of mineral or rock that settle to the seafloor (12.1)
a plume of hot rock (not magma) that rises through the mantle (either from the base or from part way up) and reaches the surface where it spreads out and also leads to hot-spot volcanism (4.9)
the supercontinent that existed between approximately 300 and 180 Ma; it contained all of the modern continents combined into a single land mass (4.1)
(Megaannus) millions of years before the present
the Earth’s crust underlying the continents (as opposed to ocean crust) (3.2)
when part of a plate is forced beneath another plate along a subduction zone (4.3)
the sloping region along which a tectonic plate descends into the mantle beneath another plate (4.6)
a geologic period that spans 79 million years from the end of the Jurassic Period 145 million years ago to the beginning of the Paleogene Period 66 mya
