
10.2 Waves at Sea
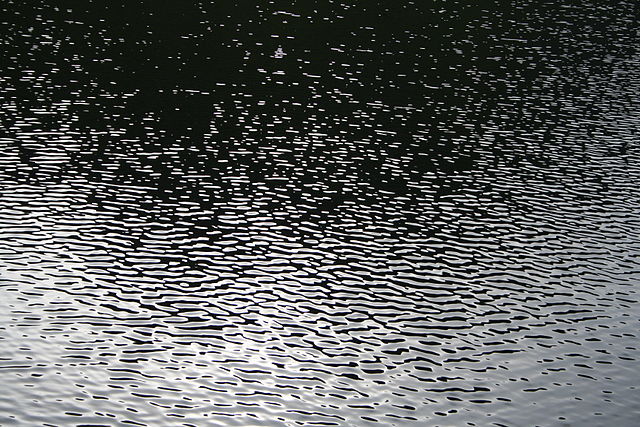
Most ocean waves are generated by wind. Wind blowing across the water’s surface creates little disturbances called capillary waves, or ripples that start from gentle breezes (Figure 10.2.1). Capillary waves have a rounded crest with a V-shaped trough, and wavelengths less than 1.7 cm. These small ripples give the wind something to “grip” onto to generate larger waves when the wind energy increases, and once the wavelength exceeds 1.7 cm the wave transitions from a capillary wave to a wind wave. As waves are produced, they are opposed by a restoring force that attempts to return the water to its calm, equilibrium condition. The restoring force of the small capillary waves is surface tension, but for larger wind-generated waves gravity becomes the restoring force.
As the energy of the wind increases, so does the size, length and speed of the resulting waves. There are three important factors determining how much energy is transferred from wind to waves, and thus how large the waves will get:
- Wind speed.
- The duration of the wind, or how long the wind blows continuously over the water.
- The distance over which the wind blows across the water in the same direction, also known as the fetch.
Increasing any of these factors increases the energy of wind waves, and therefore their size and speed. But there is an upper limit to how large wind-generated waves can get. As wind energy increases, the waves receive more energy and they get both larger and steeper (recall from section 10.1 that wave steepness = height/wavelength). When the wave height exceeds 1/7 of the wavelength, the wave becomes unstable and collapses, forming whitecaps.
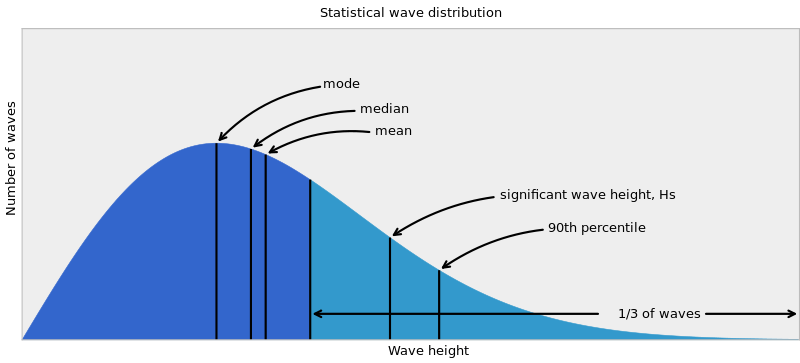
The ocean surface represents an irregular mixture of hundreds of waves of different speeds and sizes, all coming from different directions and interacting with each other. A histogram of wave heights within this mixture reveals a bell-shaped curve (Figure 10.2.2). In addition to basic statistics such as mode (most probable), median and mean wave height, wave heights are also reported in other ways. Marine weather forecasts and ship and buoy data often report significant wave height (Hs), which is the mean height of the largest one-third of the waves. Mean wave height is approximately equal to two-thirds of the significant wave height. Finally, there is the minimum height of the highest 10% of waves (the 90th percentile of wave heights), often expressed as H1/10.
Under strong wind conditions, the ocean surface becomes a chaotic mixture of choppy, whitecapped wind-generated waves. The term sea state describes the size and extent of the wind-generated waves in a particular area. When the waves are at their maximum size for the existing wind speed, duration, and fetch, it is referred to as a fully developed sea. The sea state is often reported on the Beaufort scale, ranging from 0-12, where 0 means calm, windless and waveless conditions, while Beaufort 12 is a hurricane (see box below).
The Beaufort Scale
The Beaufort scale is used to describe the wind and sea state conditions on the ocean. It is an observational scale based on the judgement of the observer, rather than one dictated by accurate measurements of wave height. Beaufort 0 represents calm, flat conditions, while Beaufort 12 represents a hurricane.
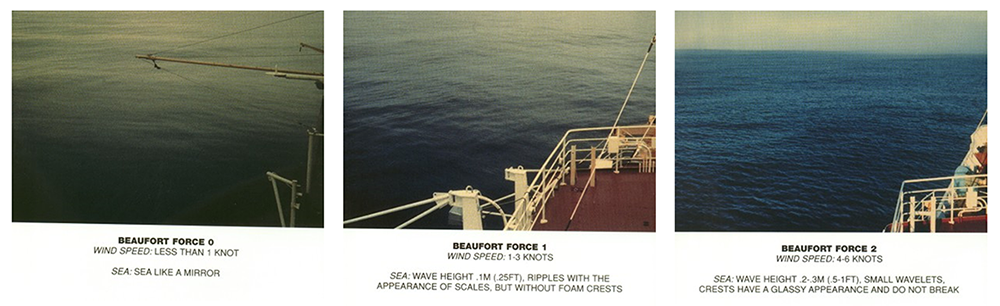
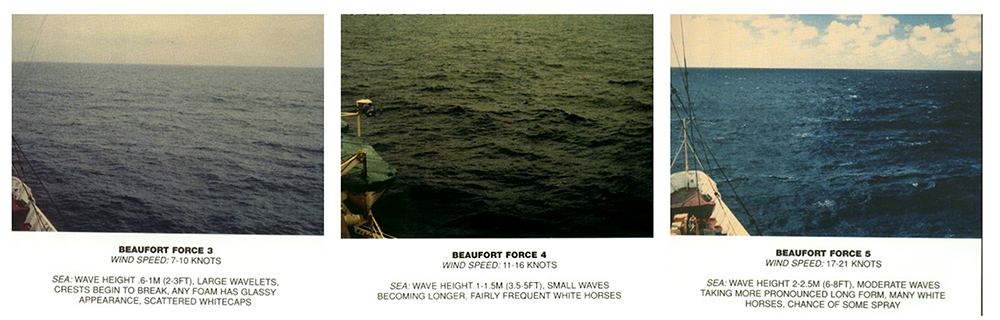
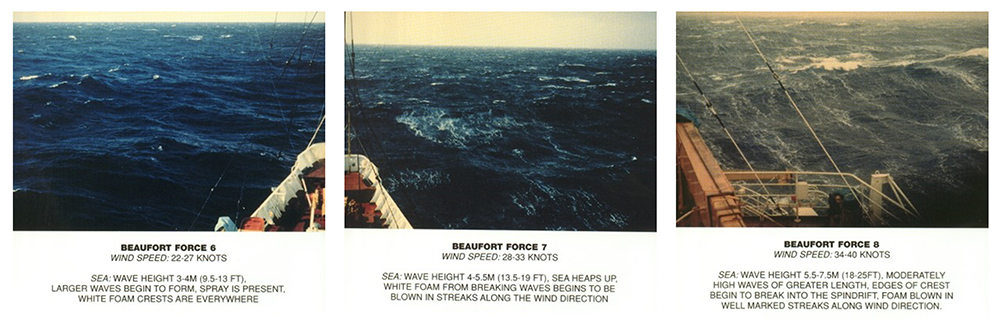
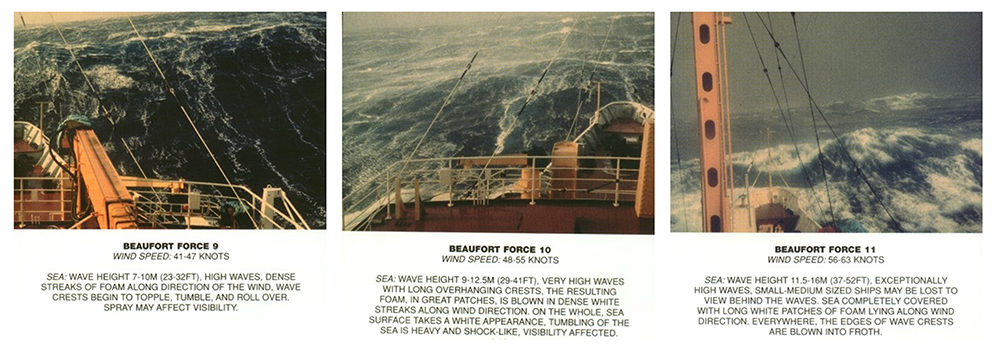
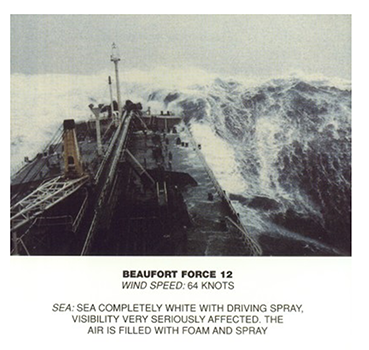
(Images by United States National Weather Service (http://www.crh.noaa.gov/mkx/marinefcst.php) [Public domain], via Wikimedia Commons).
A fully developed sea often occurs under stormy conditions, where high winds create a chaotic, random pattern of waves and whitecaps of varying sizes. The waves will propagate outwards from the center of the storm, powered by the strong winds. However, as the storm subsides and the winds weaken, these irregular seas will sort themselves out into more ordered patterns. Recall that open ocean waves will usually be deep water waves, and their speed will depend on their wavelength (section 10.1). As the waves move away from the storm center, they sort themselves out based on speed, with longer wavelength waves traveling faster than shorter wavelength waves. This means that eventually all of the waves in a particular area will be traveling with the same wavelength, creating regular, long period waves called swell (Figure 10.2.3). We experience swell as the slow up and down or rocking motion we feel on a boat, or with the regular arrival of waves on shore. Swell can travel very long distances without losing much energy, so we can observe large swells arriving at the shore even where there is no local wind; the waves were produced by a storm far offshore, and were sorted into swell as they traveled towards the coast.
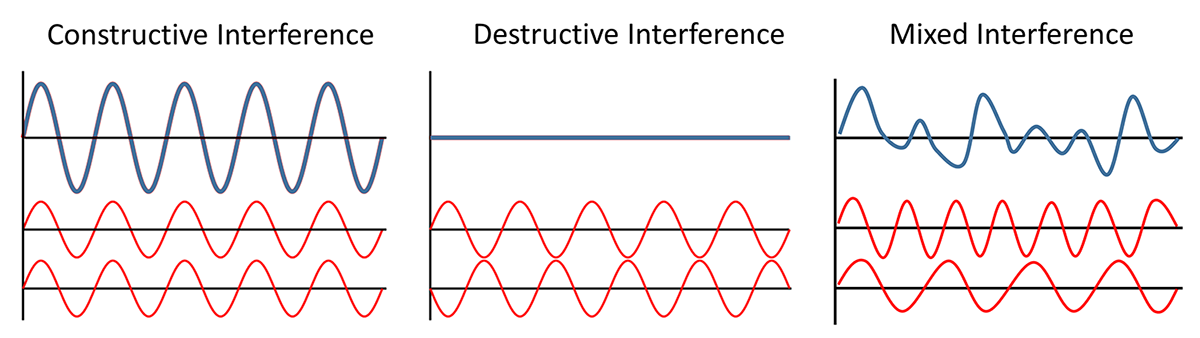
Because swell travels such long distances, eventually swells coming from different directions will run into each other, and when they do they create interference patterns. The interference pattern is created by adding the features of the waves together, and the type of interference that is created depends on how the waves interact with each other (Figure 10.2.4). Constructive interference occurs when the two waves are completely in phase; the crest of one wave lines up exactly with the crest of the other wave, as do the troughs of the two waves. Adding the two crest together creates a crest that is higher than in either of the source waves, and adding the troughs creates a deeper trough than in the original waves. The result of constructive interference is therefore to create waves that are larger than the original source waves. In destructive interference, the waves interact completely out of phase, where the crest of one wave aligns with the trough of the other wave. In this case, the crest and the trough work to cancel each other out, creating a wave that is smaller than either of the source waves. In reality, it is rare to find perfect constructive or destructive interference as displayed in Figure 10.2.4. Most interference by swells at sea is mixed interference, which contains a mix of both constructive and destructive interference. The interacting swells do not have the same wavelength, so some points show constructive interference, and some points show destructive interference, to varying degrees. This results in an irregular pattern of both small and large waves, called surf beat.
It is important to point out that these interference patterns are only temporary disturbances, and do not affect the properties of the source waves. Moving swells interact and create interference where they meet, but each wave continues on unaffected after the swells pass each other.
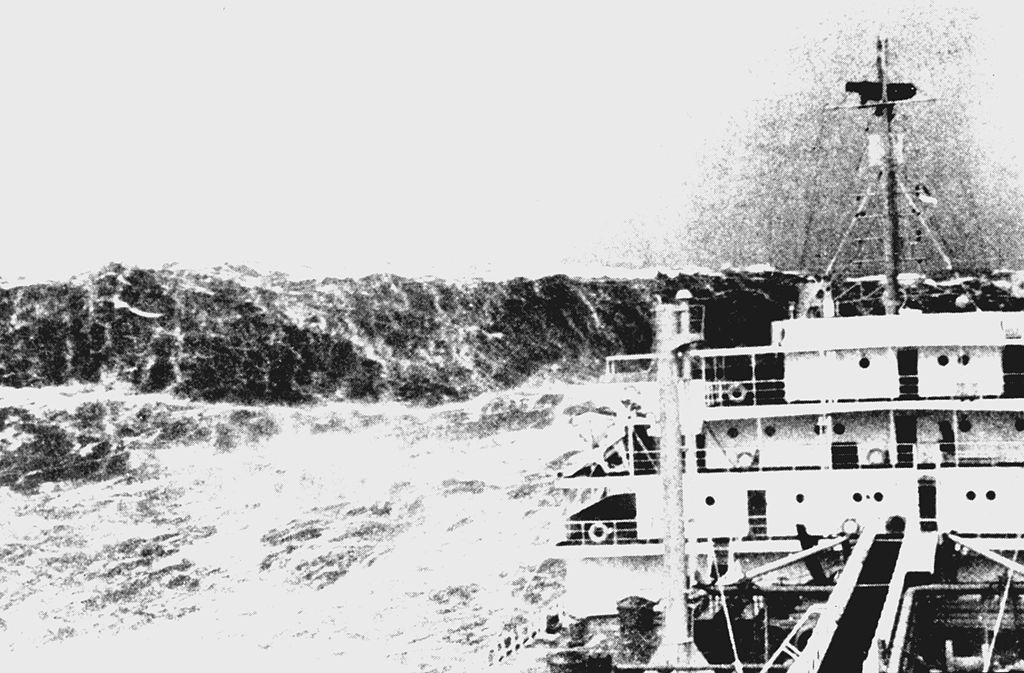
About half of the waves in the open sea are less than 2 m high, and only 10-15% exceed 6 m. But the ocean can produce some extremely large waves. The largest wind wave reliably measured at sea occurred in the Pacific Ocean in 1935, and was measured by the navy tanker the USS Ramapo. Its crew measured a wave of 34 m or about 112 ft high! Occasionally constructive interference will produce waves that are exceptionally large, even when all of the surrounding waves are of normal height. These random, large waves are called rogue waves (Figure 10.2.5). A rogue wave is usually defined as a wave that is at least twice the size of the significant wave height, which is the average height of the highest one-third of waves in the region. It is not uncommon for rogue waves to reach heights of 20 m or more.
Rogue waves are particularly common off of the southeast coast of South Africa, a region referred to as the “wild coast.” Here, Antarctic storm waves move north into the oncoming Agulhas Current, and the wave energy gets focused over a narrow area, leading to constructive interference. This area may be responsible for sinking more ships than anywhere else on Earth. On average about 100 ships are lost every year across the globe, and many of these losses are probably due to rogue waves.
Waves in the Southern Ocean are generally fairly large (the red areas in Figure 10.2.6) because of the strong winds and the lack of landmasses, which provide the winds with a very long fetch, allowing them to blow unimpeded over the ocean for very long distances. These latitudes have been termed the “Roaring Forties”, “Furious Fifties”, and “Screaming Sixties” due to the high winds.

small ripples that form on the water surface under light winds; their restoring force is surface tension (10.2)
the highest point on a wave (10.1)
the lowest point of a wave (10.1)
the distance between the crests of two waves (10.1)
the force that opposes a wave-generating force and attempts to return the sea surface to the still water level (10.2)
where a cohesive layer forms on the water surface due to attraction between water molecules (5.1)
the distance over which wind blows to form waves (10.2)
the distance between the crest and trough of a wave (10.1)
the mean height of the largest one-third of the waves in a wave spectrum (10.2)
describes the current wave conditions in an area (10.2)
a 0-12 scale describing the wind conditions at sea, often reflected in wave heights (10.2)
a wave above a water depth greater than half of its wavelength (10.1)
regular, long-period waves that have sorted themselves based on speed (10.2)
where the interaction of multiple waves creates waves larger than any of the component waves (10.2)
where the interaction of multiple waves creates waves smaller than any of the component waves (10.2)
where the interaction of multiple waves creates both constructive and destructive interference and an irregular surface pattern (10.2)
an irregular surface wave pattern caused by mixed interference (10.2)
an exceptionally large wave arising among a series of smaller waves (10.2)
the distance north or south of the equator, measured as an angle from the equator (2.1)
